Sysgram.js draw the system architecture using JavaScript.


It is a Javascript based diagramming tool that renders from javascript syntax to create and modify diagrams dynamically.
https://unpkg.com/sysgram.js@<version>/dist/sysgram.bundle.min.js
https://cdn.jsdelivr.net/gh/succeun/sysgram.js@<version>/dist/sysgram.bundle.min.js
To select a version:
Replace <version> with the desired version number.
Latest Version:
- https://unpkg.com/sysgram.js/dist/sysgram.bundle.min.js
- https://cdn.jsdelivr.net/gh/succeun/sysgram/dist/sysgram.bundle.min.js
It can insert a script tag with an absolute address and a sysgram call into the HTML like so:
<!-- sysgram (latest) -->
<script src="https://unpkg.com/sysgram.js/dist/sysgram.bundle.min.js"></script>
<script>
function drawSample() {
    var EC2 = diagrams.aws.compute.EC2

	Diagram("Simple Diagram", function() {
		EC2("web")
	})
}
sysgram.initialize({startOnLoad:true});
</script>

<div class="sysgram" data-sysgram-function="drawSample"></div>
Doing so will command the sysgram parser to look for the <div> tags with class="sysgram".
From these tags sysgram will try to read the diagram definitons and render them into <svg>.
Or you can displayed a result with <div> tags from javascript function.
<script src="../dist/sysgram.bundle.js"></script>
<script>
    function drawSample() {
        var EC2 = diagrams.aws.compute.EC2

        Diagram("Simple Diagram", function() {
            EC2("web")
        })
    }
    window.addEventListener('DOMContentLoaded', function(event) {
        sysgram.initWithCode(drawSample, '.sample');
    });
</script>

<div class="sample"></div>
When developing locally, you must have a local web server due to hpcc-js/wasm. In this case, you can load the server as follows.
npm run devAfter executing this command, open http://localhost:4000/docs/examples/basic.html in the browser.
Below is the most basic and simple example html.
<!DOCTYPE html>
<html>
<head>
	<!-- sysgram (latest) -->
	<script src="https://unpkg.com/sysgram.js/dist/sysgram.bundle.min.js"></script>
	<script>sysgram.initialize({startOnLoad:true});</script>
<head>
<body>
	<div class="sysgram">
var EC2 = diagrams.aws.compute.EC2

Diagram("Simple Diagram", function() {
	EC2("web")
})
	</div>
</body>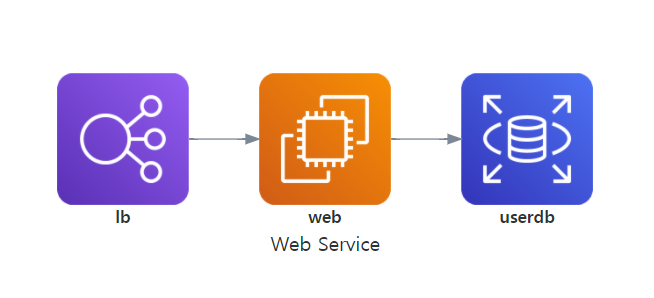
</html>var EC2 = diagrams.aws.compute.EC2
var RDS = diagrams.aws.database.RDS
var ELB = diagrams.aws.network.ELB
Diagram("Web Service", function() {
ELB("lb")._$(EC2("web"))._$(RDS("userdb"))
})
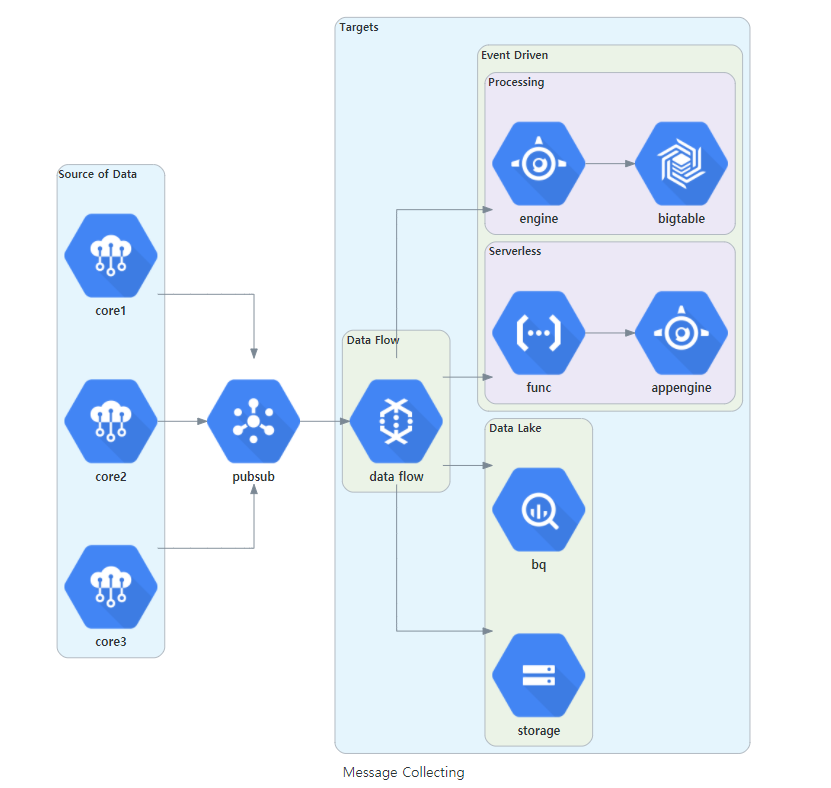
var { BigQuery, Dataflow, PubSub } = diagrams.gcp.analytics
var {AppEngine, Functions } = diagrams.gcp.compute
var BigTable = diagrams.gcp.database.BigTable
var IotCore = diagrams.gcp.iot.IotCore
var GCS = diagrams.gcp.storage.GCS

Diagram("Message Collecting", () => {
    ctx.pubsub = PubSub("pubsub")

    Cluster("Source of Data", () => {
        ArrayNode([IotCore("core1"),
                   IotCore("core2"),
                   IotCore("core3")])._$(ctx.pubsub)
    })

    Cluster("Targets", () => {
        Cluster("Data Flow", () => {
            ctx.flow = Dataflow("data flow")
        })

        Cluster("Data Lake", () => {
            ctx.flow._$([BigQuery("bq"),
                         GCS("storage")])
        })

        Cluster("Event Driven", () => {
            Cluster("Processing", () => {
                ctx.flow._$(AppEngine("engine"))._$(BigTable("bigtable"))
            })

            Cluster("Serverless", () => {
                ctx.flow._$(Functions("func"))._$(AppEngine("appengine"))
            })
        })
    })
    ctx.pubsub._$(ctx.flow)
})
Examples can be found in examples, advanced examples
Many thanks to the d3 and d3-graphviz projects for providing the graphical layout and drawing libraries!
Thanks also to the Diagrams using Python project for usage of the python syntax.
Thanks to mingrammer(MinJae Kwon) for inspiration and starting point for developing.