stickshift
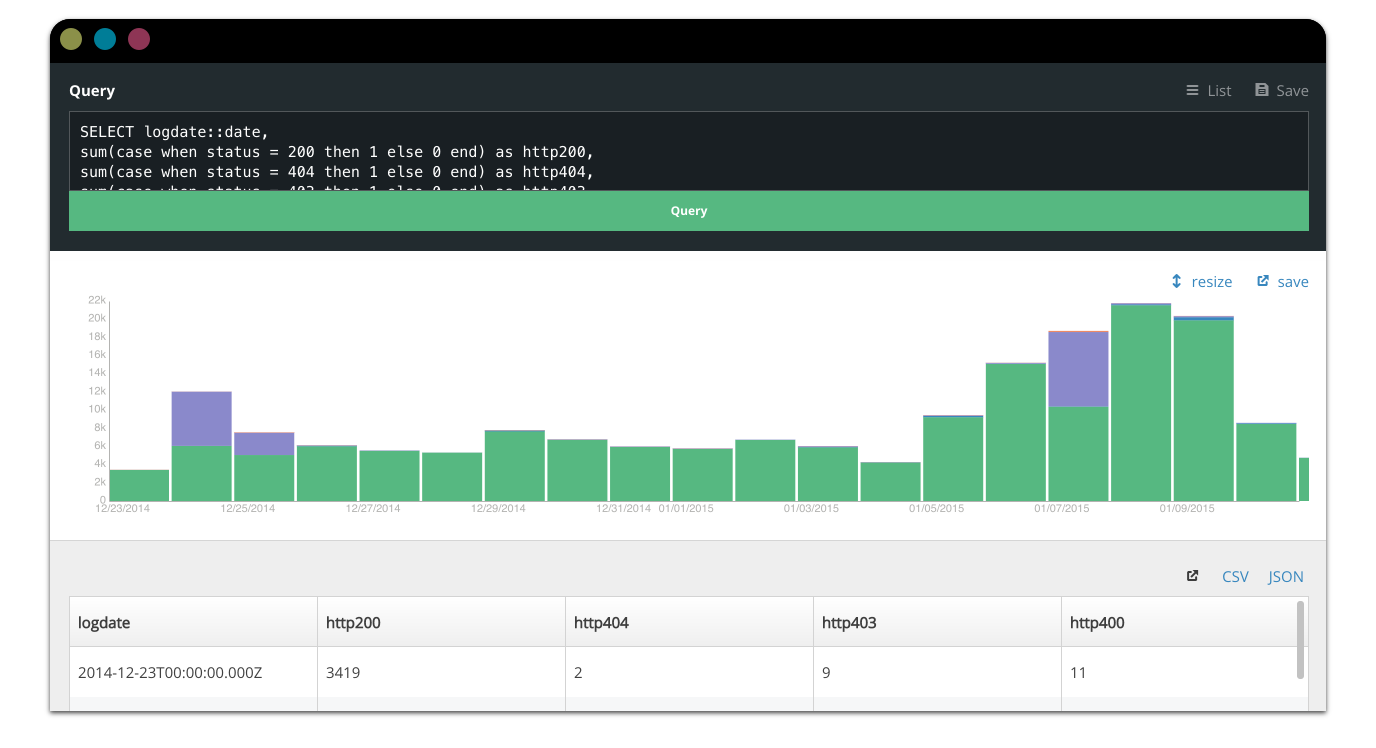
A clean & modern data interface: SQL queries into JSON, CSV, and charts, done simply.
Features
- Export query results to JSON & CSV
- Visualize some query results automatically
- Share and save queries
- Responsive on lil' screens
Installation
To run the simple demo:
$ npm install$ npm startOpen up http://localhost:3000/ and play around: the testing server
creates three tables:
fake: random time-series data
select * from fake;cats: random categorical data
select * from cats;places: points in france
select * from points;Then you can configure the server by editing configuration in site.js.
The example in example_server.js talks to SQLite,
but you can swap in Postgres/RedShift using the pg module,
MySQL using the mysql module, and so on. Or you can even just point
stickshift at any URL that accepts queries over POST and returns
results as JSON.
Configuration
Stickshift exposes a JavaScript API of the form:
var Stickshift = ; ;Calling Stickshift props up the full interface and router within the given
element.
Architecture
stickshift is built with React,
Flux,
and React-Router. It's written
in CommonJS & ES6 and cross-compiled with browserify
& babelify. Query storage is powered by hubdb.
Structure:
src/components: UI components, like the chart, table, and query interfacesrc/stores: Flux stores for saved queries & transient table informationsrc/constants: Constants for actions, like 'received table results'lib/d3 & vega, for now, until vega builds are sorted
Bring your own auth
There's no user login system built into stickshift: like your choice of
database, this is likely to be specific to your purpose, company, usage,
and so on. Some common approaches include:
- Running it locally or behind a firewall
- Ditching
example_server.jsand integrating with a server that does authentication, like through passport. This is what we do at Mapbox.
If you run this on anything but a localhost, it's really best practice
to create a read-only user, since this is an interface for doing analysis
that should not have permissions to modify data.
Charts
Stickshift automatically creates charts for applicable queries: those that
- Have at least one column that is parseable as numbers.
The supported chart types are:
- Time series
- Lines
- Stacked bars
- Categorical
- Grouped bars
- Geographical
- Points
These charts are rendered with Vega. They're designed for exploratory data analysis, so are relatively simple.
Maps are rendered by Mapbox.js with Mapbox tiles.
Development
- Run
npm run developto continously rebuild source and run Stickshift without a node server.