Table of Contents
StackedArea
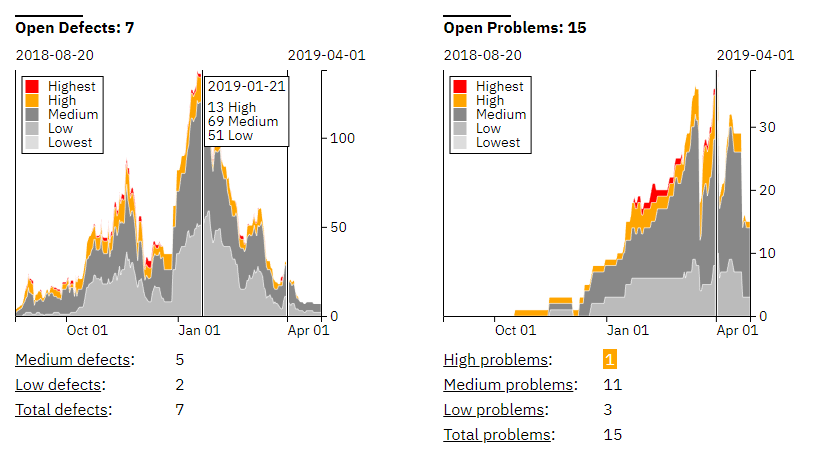
Draw SVG Stacked Area Charts.

Install in your Node project with
npm i stacked-area
and use it inside your code via
const stackedArea = require('stacked-area');
or, alternatively
import stackedArea from 'stacked-area';
Create the new stackedArea objects via
let diagram = stackedArea(settings);
Parameters
settingsObject The configuration object for the diagram. All data for the diagram is provided with this object. In this configuration object, whenever a date is to be given, it can be an ISO 8601 String or a JavaScript Date object. A Moment object is also fine.settings.titleString? The title for the diagram.settings.legendTitleString? The title for the legend.settings.svgObject The DOM tree element, wich must be an svg tag. The diagram will be attached to this DOM tree element. Example:settings.svg = document.getElementById('stackedAreaDiagram');'stackedAreaDiagram'is the id of a svg tag.settings.widthNumber? The width of the diagram in pixels, the margin settings have to be included in that width.settings.heightNumber? The height of the diagram in pixels, the margin settings have to be included in that height.settings.margin{top: Number, right: Number, bottom: Number, right: Number}? The margin for the diagram. Default values are:settings.margin = { top: 50, right: 50, bottom: 50, left: 50 }settings.fromDate(String | Date)? The start date for the diagram. Example:settings.fromDate = '2018-09-01';
settings.toDate(String | Date)? The end date for the diagram. Example:settings.toDate = '2018-09-05';
settings.markersArray<{date: (String | Date), label: String}>? Highlight specific dates inside of the diagram with markers. Each marker is an object with a date for the marker and an optional label. Example:settings.markers = [ { date: '2018-09-03', label: 'M1' }, { date: '2018-09-10', label: 'M2' }];settings.drawOptionsArray<String>? An array to determine the parts to be drawn. Possible options:'title' - draw the title 'axis' - draw the x and y axis 'legend' - draw the legend information 'markers' - draw the markers 'focus' - draw detailed data when hovering the diagram
By default all of these draw options are on.settings.styleObject? Influence the appearance of the diagram with typeface and colors. The defaults are:settings.style = { fontSize: 12, fontFamily: 'sans-serif', color: '#222', backgroundColor: '#fff', axis: {color: '#222'}, markers: {color: '#222', backgroundColor: '#fff'} }You may configure colors for each stacked area, like for a chart with stacked areas named 'Highest', 'High', 'Medium' and 'Low':settings.style.Highest = { color: 'chartreuse', stroke: 'white' }; settings.style.High = { color: 'cornflowerblue', stroke: 'white' }; settings.style.Medium = { color: 'darkorange', stroke: 'white' }; settings.style.Low = { color: 'firebrick', stroke: 'white' };settings.data{keys: Array<String>, entries: Array<Object>} The data for the diagram. Example:settings.data = { keys: ['Low', 'Medium', 'High', 'Highest'], entries: [ { date: '2018-09-03', Highest: 0, High: 0, Medium: 0, Low: 0 }, { date: '2018-09-04', Highest: 1, High: 0, Medium: 0, Low: 0 }, { date: '2018-09-05', Highest: 1, High: 1, Medium: 0, Low: 0 }, { date: '2018-09-06', Highest: 1, High: 0, Medium: 1, Low: 1 }, { date: '2018-09-07', Highest: 2, High: 1, Medium: 0, Low: 2 }, { date: '2018-09-08', Highest: 1, High: 1, Medium: 2, Low: 2 }, { date: '2018-09-09', Highest: 0, High: 0, Medium: 1, Low: 5 }, { date: '2018-09-10', Highest: 1, High: 1, Medium: 0, Low: 5 } ]}Each entry object must contain a date and the counts for the keys. Each key will be rendered as a stacked layer. The rendering of the stacked layers will follow the order of the keys. Hereby left to right keys leads to stacked areas from bottom to top.
draw
Draw the Stacked Area Chart inside of the provided settings.svg DOM tree element.
remove
Clear the chart from the provided settings.svg DOM tree element
imageSource
Draw the Stacked Area Chart inside of the provided settings.svg DOM tree element
and return the result as a string which can be assigned to the SRC attribute of an HTML IMG tag.
Returns string
svgSource
Draw the Stacked Area Chart inside of the provided settings.svg DOM tree element
and return the result as a SVG tag string.
Returns string