📉 Retention
Calculate user retention matrix and render table or chart with data


What?
This library calculates retention metric, which answers the question: how many users1 that registered2 in a given week3 were active4 in the following weeks. In other words, how soon and how many users are abandoning you product/app or some specific feature.
1. or accounts, or instances; 2. or started trial, or enabled some feature; 3. or in any other time range; 4. or did some specific action
Why?
Some services (e.g. keen.io) don't have built in tool or API to calculate retention metric, so you have to do it on your own. Existing tools, like keen.io's cohort builder, are usually locked into specific provider and are not very flexible - for example I needed something where I can use multiple events to determine the "active" user.
How?
You have to provide two kinds of data sets. First, an Array of events that define your "registered" actions, i.e. initial events. Every event is an Object with date and id props:
id: 'b7f1181a' date: '2018-02-19T16:57:12.188Z' // ...more events;The second data set is an Array of user IDs that were active in a given time range. You have to provide this for every time range you want to calulate, i.e. if you want retentnion for the last four weeks, you should provide four Arrays like this:
'855fc7a1' '5c8325a9' '2a26adea' '6623141d' '269f7d39' '832c4038' 'b7f1181a' // ...more IDs;And that's it. The buildMatrix function will return a retention matrix that looks like this:
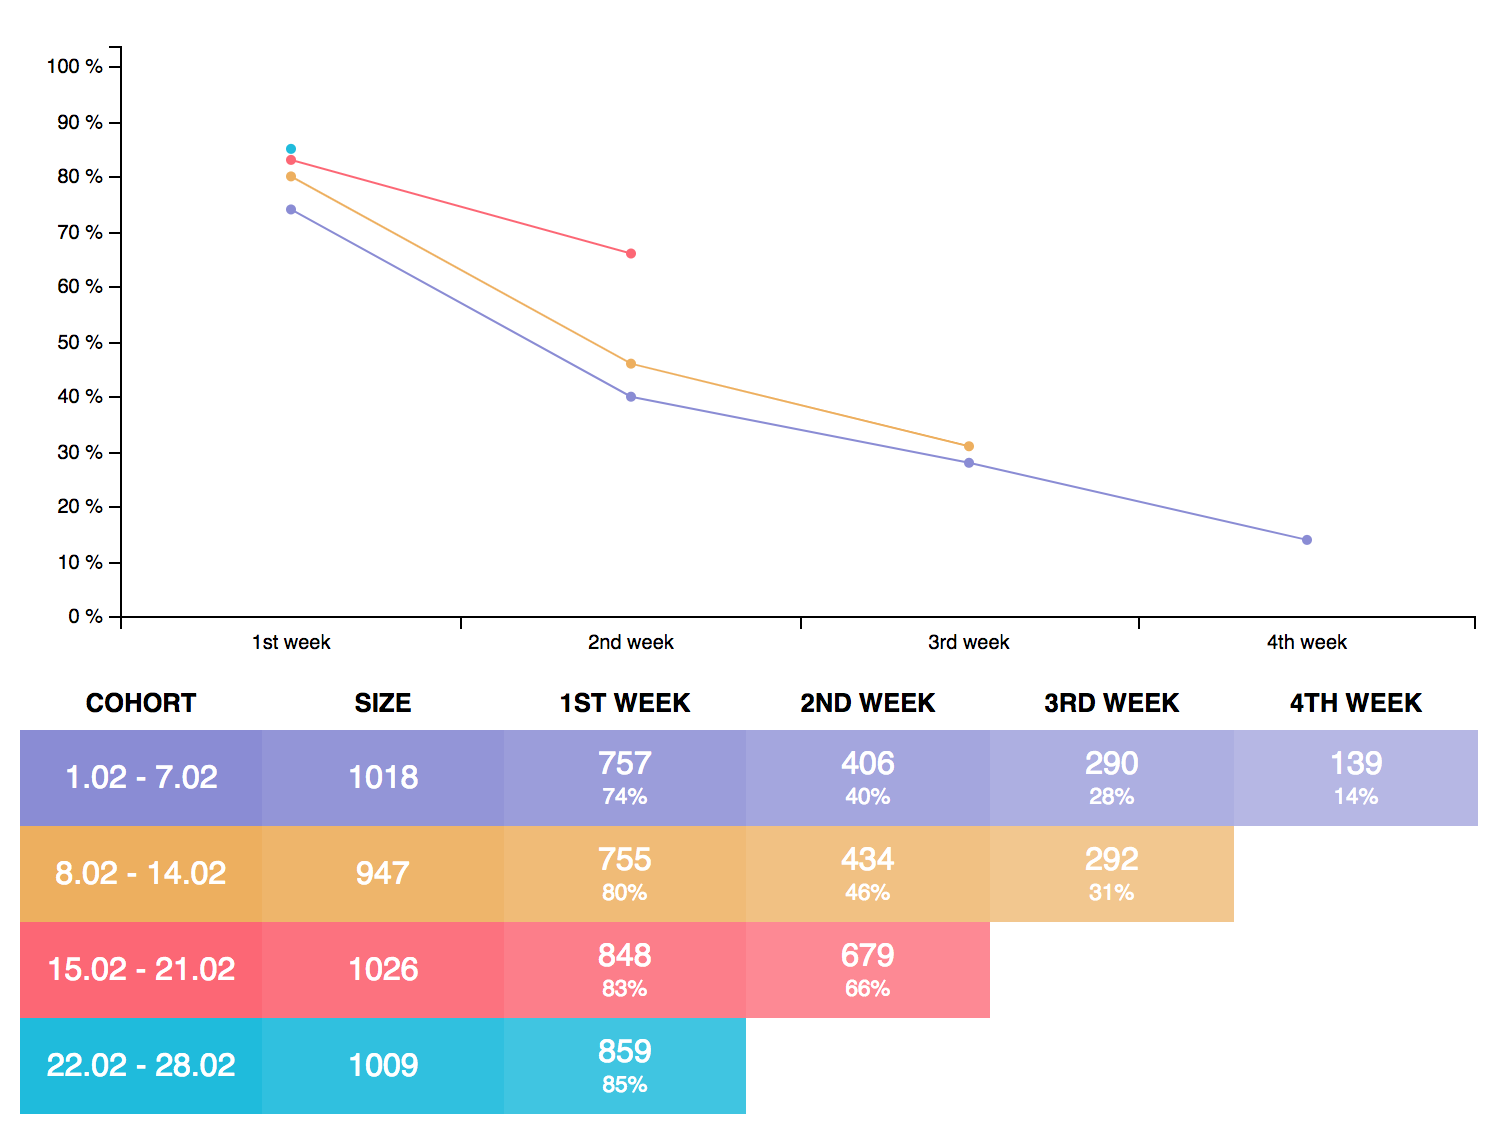
range: from: '2018-02-01T00:00:00.000Z' to: '2018-02-07T23:59:59.999Z' cohort: id: 'b7f1181a' date: '2018-02-19T16:57:12.188Z' // ...more IDs activity: activeCount: 757 percentage: 74 active: id: 'b7f1181a' // events: [ 'action-a', 'action-b ] // ...more IDs // ...more time ranges // ...more time ranges;You can specify more than one Array of active users for every time range (e.g. for different actions they're performing, see below) and it will be included in every object in the active array in the events property.
Both renderTable and renderChart functions take this matrix plus some configuration options as input.
Regarding performance, it calculates and renders both table and chart in a reasonable time (<1s) on a Macbook Pro for up to ~20k unique user IDs (4 week retention). However, in such case I recommend to move the matrix calculation to some back-end service or pre-compute it offline. But let's be honest, if you have more than 20k unique users per month you wouldn't be using this simple library that I wrote over the weekend, would you? 🤔
Installation
$ npm i retentionD3 and C3 libraries are not included in the bundle, you have to install them separately.
ES6 modules
;CommonJS
const buildMatrix = ;Notice: Because CJS modules are almost always used in NodeJS backend code (Webpack or Rollup should automatically use UMD or ESM version), this version includes only buildMatrix function, no rendering functions. If you want those you should probably explicitly include the UMD version:
const buildMatrix renderTable renderChart = ;Browser
CSS
There's also a simple CSS file which adds some styling to the table:
Sample
Clone the repo, install dependencies, build the bundle, and start a simple web server with these commands:
git clone https://github.com/marszall87/retention.gitcd retentionnpm installnpm run buildnpm run sampleNavigate to http://localhost:5000/sample and you should see a sample retention chart and table.
API
buildMatrix(opts)
Returns promise with retention matrix object.
opts.dateRanges - Array of { from, to } objects that defines date ranges for cohorts, if not specified it's 4 last weeks
opts.getInitialEvents - function that should return a promise with Array of objects with two props: date and id, date represents
opts.getActivity - function or object in form of { eventsA: () => {...}, eventsB: () => {...} }, functions take three args: start date, end date and index of a given cohort date range, should return an Array of ids that were active in that time
generateRanges(opts)
Helper function that generates cohor date ranges.
opts.endingDate - ending date of the last (most recent) cohort, end of the current day by default
opts.daysInRange - number of days in every date range, default is 7
opts.rangeCount - number of date ranges to generate, 4 by default
renderTable(opts)
opts.container - container in which the table will be rendered
opts.matrix - retention matrix as returned by buildMatrix()
renderChart(opts)
opts.container - container in which the chart will be rendered
opts.matrix - retention matrix as returned by buildMatrix()
opts.options - options passed directly to c3.generate function, can be used to modify the chart, full list of options available in C3 docs.
License
MIT © Michał Nykiel