react-native-f2chart
F2 charts for react-native
install
1、
yarn add react-native-f2chart or npm i react-native-f2chart
2、 copy node_moules/react-native-f2chart/src/f2chart.html to android/app/src/main/assets/f2chart.html
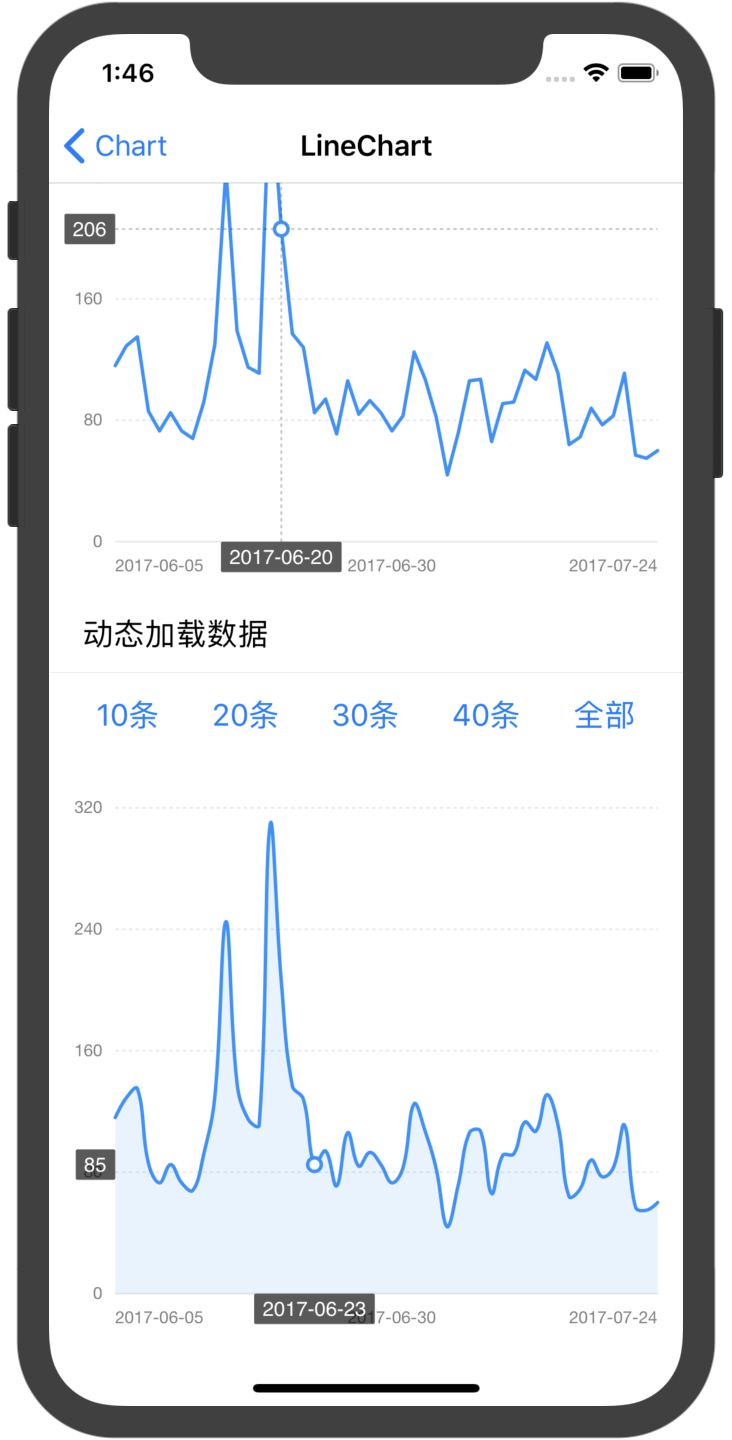
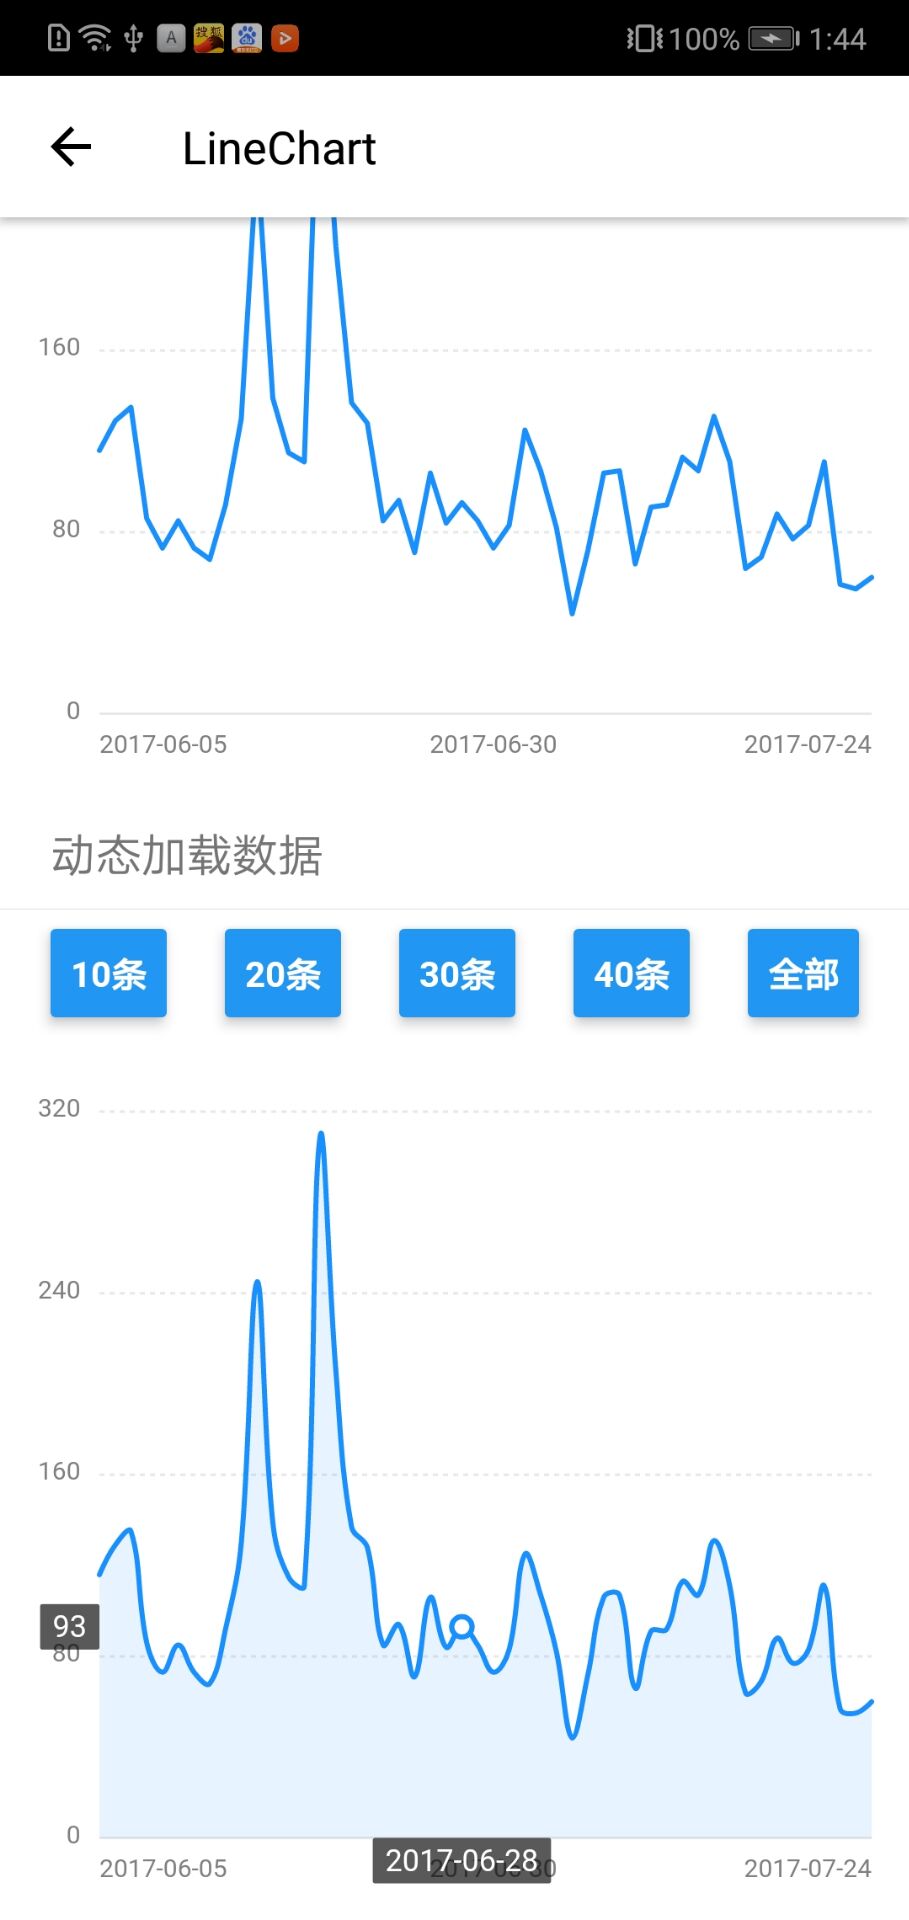
simple demo example
usage
; // 参考 https://antv.alipay.com/zh-cn/f2/3.x/demo/line/basic.htmlconst initScript = `(function(){ chart = new F2.Chart({ id: 'chart', pixelRatio: window.devicePixelRatio, }); chart.source(, { value: { tickCount: 5, min: 0 }, date: { type: 'timeCat', range: [0, 1], tickCount: 3 } }); chart.tooltip({ custom: true, showXTip: true, showYTip: true, snap: true, onChange: function(obj) { window.postMessage(stringify(obj)) }, crosshairsType: 'xy', crosshairsStyle: { lineDash: [2] } }); chart.axis('date', { label: function label(text, index, total) { var textCfg = {}; if (index === 0) { textCfg.textAlign = 'left'; } else if (index === total - 1) { textCfg.textAlign = 'right'; } return textCfg; } }); chart.line().position('date*value'); chart.render();})();`; ... { return <View style= height: 350 > <Chart initScript= /> </View> } ...`Props
| Prop | type | Description | Required |
|---|---|---|---|
initScript |
string | 初始化图表的 js 代码,参考 f2 的文档 | yes |
data |
Array | f2 chart source | no |
onChange |
Function | tooltip onchange | no |
webView |
ReactElement | 渲染图表的 webview,可以使用 react-native-webview 代替,默认使用 react-natve 里面的 webview | no |
Notice
- chart 已经在源码的 html 定义过了,在
initScript中,并不需要定义 chart,直接给 chart 赋值即可 - tooltip onchange 中 传输数据时用到的
stringify也是在 html 定义好的,可以直接使用,用JSON.stringify会报错, 原因 - 如果使用的是
react-native-webview,在 tooltip 中的postMessage应该为window.ReactNativeWebView.postMessage