pViz.js: a dynamic JavaScript & SVG library for visualization of protein sequence features
Head straight for working examples, demo applications and code documentation here
What is pViz.js?
pViz.js is a protein sequence features viewer for modern browsers, based on a JavaScript library, SVG and css.
Given a sequence and a list of positioned features, it displays the sequence and aligns the features to the sequence. Features are layed out to not overlap each other, allowing zooming, interaction and customization.
Default sources can be explicitly defined in JavaScript (sky is the limit), DAS servers, PEFF (PSI extended Fasta format) or any combination of them.
Warning! pViz prefers modern browsers, such as Firefox, Chrome and Safari. Do not expect it to work on IE7, just upgrade.
Hello World
Creating a basic pViz application takes only three steps:
-
Download two files from github.
-
pviz-bundle.min.js-
pviz-core.css -
Create an HTML file in the directory, with the content shown below.
-
Open the file in your browser.
.
<head>
<link rel="stylesheet" type="text/css" href="pviz-core.css">
<script src="pviz-bundle.min.js"></script>
</head>
<body>
<div id="main"></div>
<script>
var pviz = this.pviz;
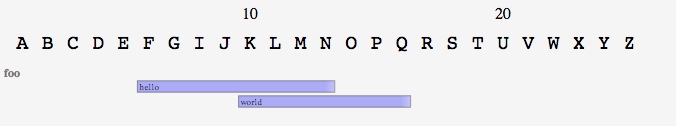
var seqEntry = new pviz.SeqEntry({sequence : 'ABCDEFGIJKLMNOPQRSTUVWXYZ'});
new pviz.SeqEntryAnnotInteractiveView({
model : seqEntry,
el : '#main'
}).render();
seqEntry.addFeatures([
{category : 'foo', type : 'bar', start : 5, end : 12, text : 'hello'},
{category : 'foo', type : 'bar', start : 9, end : 15, text : 'world'}]);
</script>
</body>
Et voilà...The rendered features. In practice, the widget is zoomable
How does it work?
Principles
A SeqEntry object contains a sequence, a list of features (and whatever you may find convenient for later display).
Structure
Features are added to the model (if the view is already instanciated, it will be updated once the features are received, thanks to backbone.js). A feature is a JavaScript object (a plain hashmap, though), containing several fields
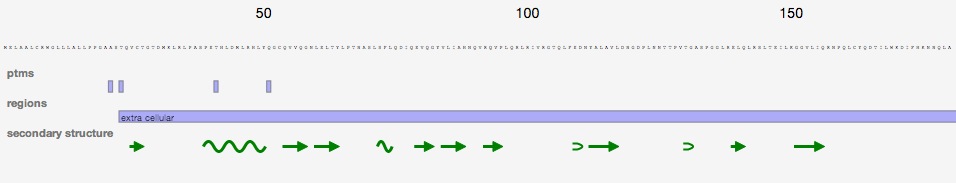
- groupSet [optional]: a group of categories which allows features with the same category name, to be grouped at first by groupSet;
- category: all features from the same category will be handled in the same layer;
- categoryType [optional]: has no grouping purpose, but allows to define properties among different categories (track height, css);
- type: within a category, features can have different types, offering the possibility for custom render (default is just a rectangle) or interaction;
- start: starting position (0 is the first amino acid of the sequence);
- end: an inclusive end position;
- text [optional]: text to be be displayed in the default rectangle;
- Whatever you may need for customized display or interaction.
Third parties dependencies
pViz library uses D3 for SVG generation, backbone.js framework for the model/view framework, Twitter Bootstrap for the css, underscore.js library for convenient utilities, and require.js for dependency management.
But do not worry, including the packaged distribution bundles all of them for you.
Examples
The working examples and demo applications can be found here.
Full documentation can be found here.
Easier than a full documentation, we bring some demonstration use cases:


NB: download the project locally, at least on your file system, to get javascript executed;
And more
A few comments on the code
The JavaScript library relies on some "modern" language components. That said, you can either use the bundled library (with all dependencies) or created you own application using require.js and checked out source code.
Unit testing
Via Jasmine, either in the browser (test/index.html) or command line with phantom.js
Continuous integration
Testing, distribution etc. can be launched in a CI environment via grunt tasks grunt test, build...
Build code documentation
JsDoc3 annotations were used to document the library. To generate the doc (in examples/doc directory):
grunt jsdoc
Build code documentation
JsDoc3 annotations were used to document the library. To generate the doc (in examples/doc directory):
Authors
This library was initiated by Alexandre Masselot (masselot.alexandre@gene.com) & Kiran Mukhyala (mukhyala.kiran@gene.com) within Genentech Bioinformatics & Computational Biology Department.
Reference
Please refer to this library via "Visualization of protein sequence features using JavaScript and SVG with pViz.js - Mukhyala K, Masselot A - Bioinformatics. 2014 Aug"
License
The library is distributed under a BSD license. Full description can be found in LICENSE.txt