This module allows the generation of D3 visualizations on the server.
Visualizations can be exported in HTML, SVG or PNG (via PhantomJS).
As simple as:
npm install prettydata
If you are more the Yarn kind of guy then go for:
yarn add prettydata
Using Pretty Data is very simple. If you know d3, you know how to use Pretty Data.
const PrettyData = require('prettydata');

const WIDTH = 1280
const HEIGHT = 800;

const prettyData = new PrettyData(WIDTH, HEIGHT);

//This is the root SVG object where the entire chart will be rendered
const svg = prettyData.$;

//This is the same d3 object you'd use in a browser
const d3 = PrettyData.d3;

//Optionally, set some style rules
prettyData.css = {
    'rect.bordered': {
        stroke: '#E6E6E6',
        strokeWidth: '2px'
    },
    'text.mono': {
        fontSize: '9pt',
        fontFamily: 'Consolas, courier',
        fill: '#aaa'
    },
    'text.axis-workweek, text.axis-worktime': {
        fill: '#000'
    }
};

//
//Do your d3 stuff here...
//

//Generate HTML file output
prettyData.html()
    .then(PrettyData.to('myfile.html')))
    .catch(console.error);

//Generate SVG file output
prettyData.svg()
    .then(PrettyData.to('myfile.svg')))
    .catch(console.error);

//Generate PNG file output
prettyData.png()
    .then(PrettyData.to('myfile.png')))
.catch(console.error);If you want to render a d3 visualization on the server using exactly the same code you use on the client, transitions may get in the way.
When Pretty Data generates the snapshot of the SVG generated by d3 the transition isn't complete (or it's not going to happen at all, this I still have to figure out).
To overcome this problem, you can either make sure that the chart is generated on the server you get rid of all the transitions, or you can disable all the transitions with
PrettyData.disableD3Transitions();An example of this is in transition.js:
//Disable d3 transitions
PrettyData.disableD3Transitions();

const prettyData = new PrettyData(960, 500);
const svg = prettyData.$;
const d3 = PrettyData.d3;

svg.append("circle")       // append a cicle to the svg
    .attr("fill", "blue")   // fill the circle with 'blue'
    .attr("r", 20)          // set the radius to 10 pixels
    .attr('cx', 40)         // position the circle at 40 on the x axis
    .attr('cy', 250)        // position the circle at 250 on the y axis
    .transition()           // apply a transition
    .duration(4000)         // apply it over 4000 milliseconds
    .attr('cx', 920);       // new horizontal position at 920 on x axis
When the PNG, SVG and HTML files are generated, the visualization will be in its completed status, as if the transition already happened.
This method is still very experimental and currently only covers the delay, duration and ease methods of the Transition object.
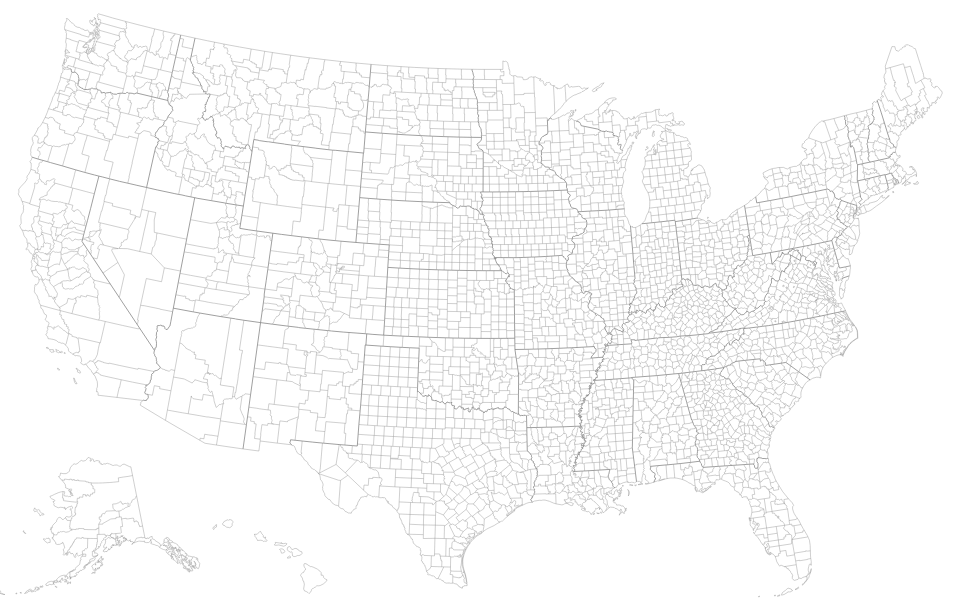
Source: https://bl.ocks.org/mbostock/4136647.
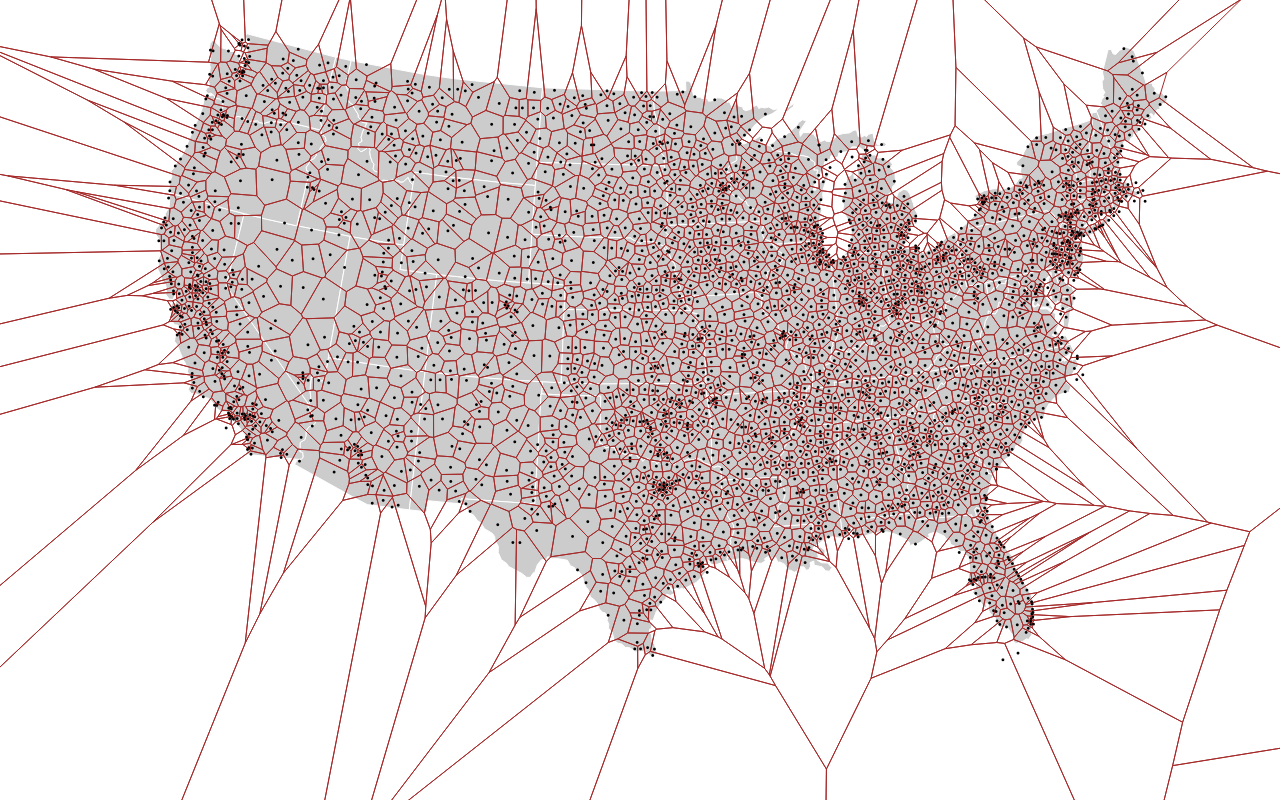
Adapted from: http://mbostock.github.io/d3/talk/20111116/airports-all.html.
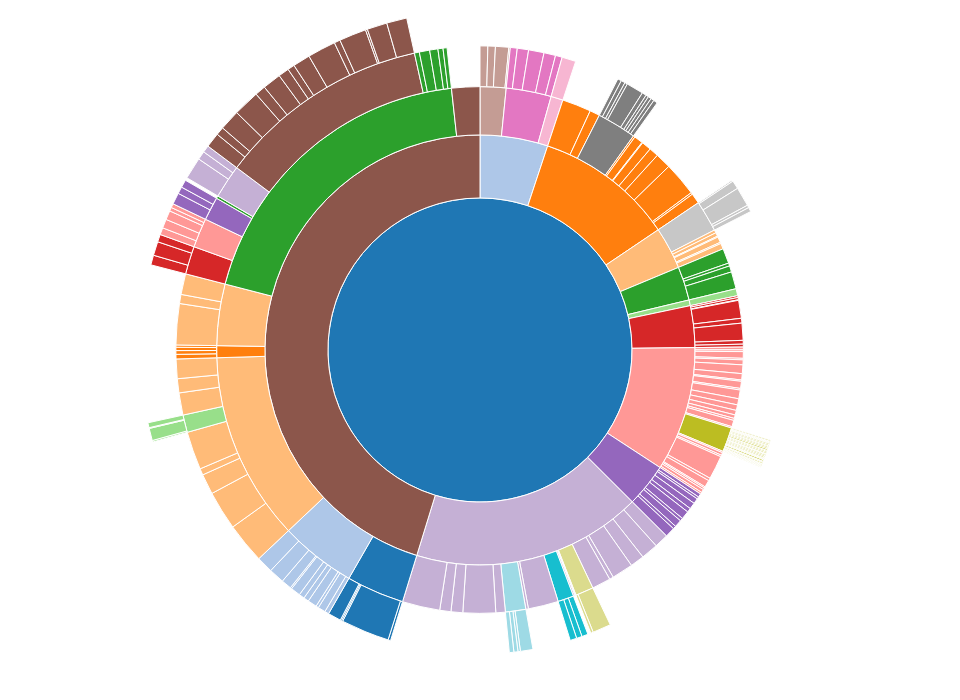
Minimally adapted from: https://bl.ocks.org/maybelinot/5552606564ef37b5de7e47ed2b7dc099.
In this example the data is pulled on the fly as JSON using node-fetch.
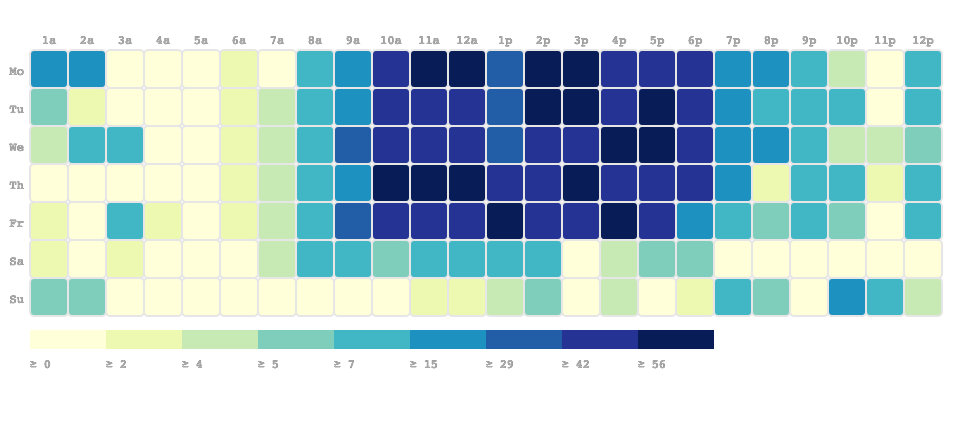
Source: http://bl.ocks.org/ganezasan/dfe585847d65d0742ca7d0d1913d50e1.
In this example the chart is styled using the css API exposed by Pretty Data:
prettyData.css = {
    'rect.bordered': {
        stroke: '#E6E6E6',
        strokeWidth: '2px'
    },
    'text.mono': {
        fontSize: '9pt',
        fontFamily: 'Consolas, courier',
        fill: '#aaa'
    },
    'text.axis-workweek, text.axis-worktime': {
        fill: '#000'
    }
};