njstrace + plotly
quick and dirty visualization of node.js function tracing.
Plugin (formatter) for njstrace
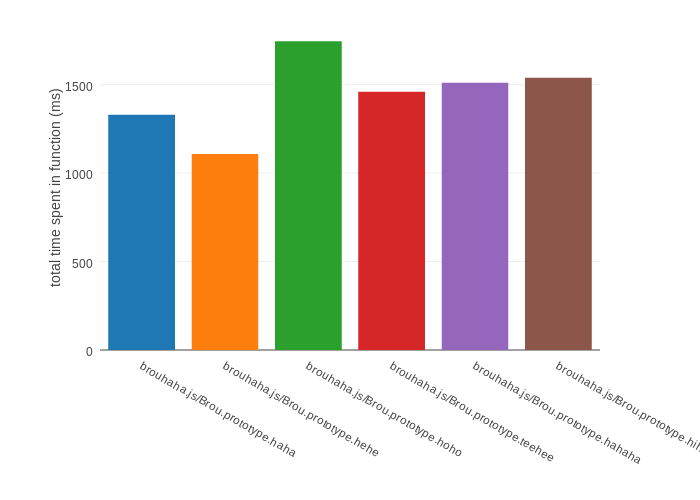
This formatter will output a bar chart with each bar representing the time spent in each function. Functions are labelled with the file they were called from.
Usage
var PlotlyFormatter = ; var traceOptions = formatter: 'username' 'apiKey' 'graph name' 5000 ; // Call inject and use plotly formatter in optsvar njstrace = ; var Brou = ;var brou = ; // Do some stuff on "b";Outputs
Click here for the interactive graph.
PlotlyFormatter(username, apiKey, graphName, interval, layout)
usernameis your Plotly usernameapiKeyis your Plotly api keygraphNameis your desired graph nameintervalis the frequency to post your data to plotly (default 5s)layoutoptional is a Plotly layout object (default used if none specified)
Installation
npm install njstrace-plotly-formatter