Patternomaly
Easily generate patterns for use in data graphics.

But why?
Color-blindness, that's why.
This library came about as part of an issue in Chart.js.
Usage
npm install patternomaly
Generate a single canvas pattern
pattern.draw('square', '#1f77b4');
Generate an array of canvas patterns
pattern;Available Patterns
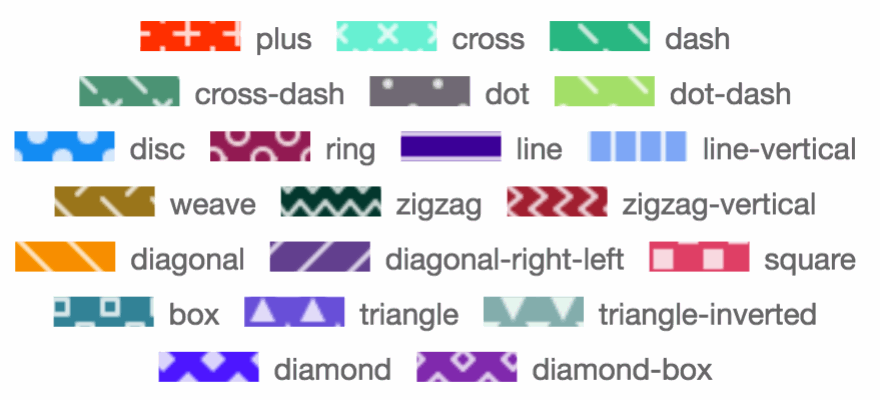
There are currently 21 pattern variants available. When using the generate method (above) patterns will be 'randomly' assigned.
It is however possible to provide specific patterns using the draw method.
datasets: data: 300 50 100 210 140 backgroundColor: pattern pattern pattern pattern pattern // with opacity Pattern Keys
- plus
- cross
- dash
- cross-dash
- dot
- dot-dash
- disc
- ring
- line
- line-vertical
- weave
- zigzag
- zigzag-vertical
- diagonal
- diagonal-right-left
- square
- box
- triangle
- triangle-inverted
- diamond
- diamond-box

Thanks to obedm503 for generating the example pattern image.
Providing a Pattern Alternative
In order to provide an alternative view for visually impaired viewers it's a good idea to provide a patterned alternative.
See the pattern option example page for a simple implementation of a pattern toggle switch for Chart.js.
Typescript / Angular
A typings file is included in this package. Just insert import {draw, generate} from 'patternomaly' in the header of your .ts file.
Still you have to add the javascript file to your build e.g. in the scripts array in angular.cli.json e.g. "scripts": ["node_modules/patternomaly/dist/patternomaly.js"].
