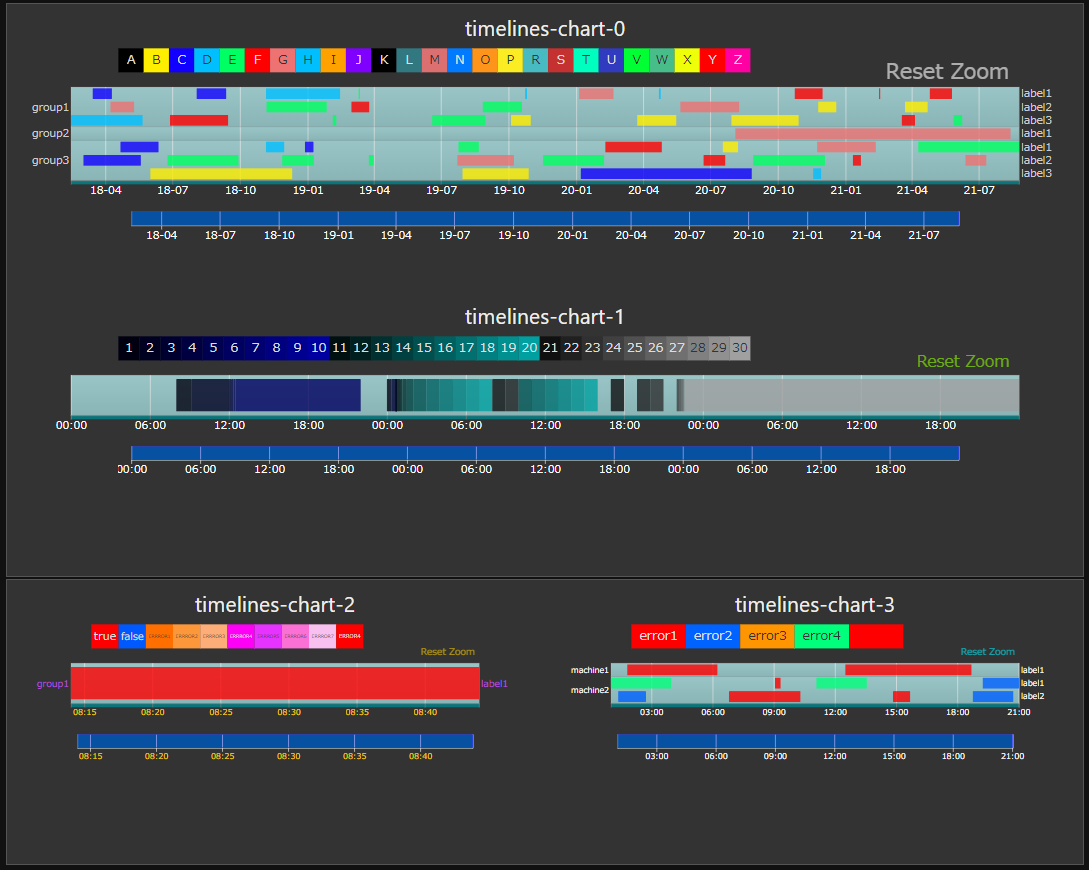
node-red-contrib-ui-timelines-chart
A Node-RED widget node for showing the timelines chart.
Pre-requisites
The node-red-contrib-ui-timelines-chart requires Node-RED Dashboard 2.10 to be installed.
Quick Start
To pull from docker hub:
docker pull sanlike0911/node-red-contrib-ui-timelines-chart:latestInstall
npm install node-red-contrib-ui-timelines-chartNote: This node uses APIs that require at least Node-RED 0.19 and Node-RED Dashboard 2.10.
Usage
"ui-timelines-chart" node is a UI widget that can be used to display the timelines chart in the Node-RED dashboard.
This Node-Red module can not directly connect to Database.
-
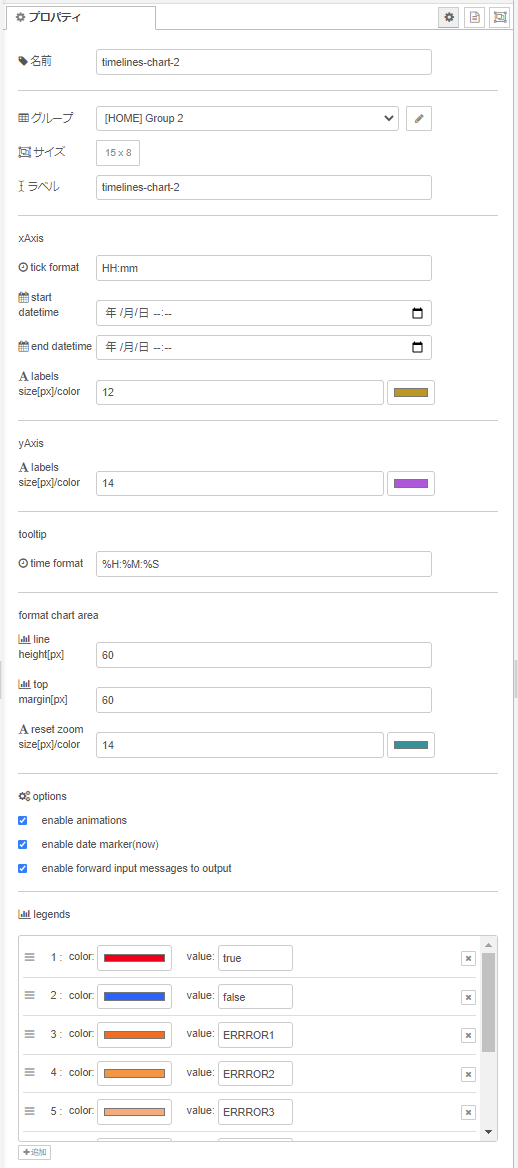
Widget properties
-
name
Set the node name to be displayed in flow.
-
group
Set the group to be displayed on the dashboard.
-
size
Set the size on the dashboard.
-
label
Set for the name to be displayed on the dashboard.
-
xAxis
-
tick format
Set the tick format of the X-Axis.
- YYYY-MM-DD HH:mm:ss
- YYYY-MM-DD
- HH:mm:ss
- HH:mm
- HH
....
*ISO 8601 format
-
start date
Set the start time of the X-Axis. If not set, select the first data.
-
end date
Set the end time of the X-Axis. If not set, select the last data.
-
labels size[px]/color
Set the font size[in pixels] and font color to X-Axis label. size: from 0 to 64(default:16)
-
-
yAxis
-
labels size[px]/color
Set the font size[in pixels] and font color to Y-Axis label. size: from 0 to 64(default:16)
-
-
tooltips
-
time format
Set the time format of tooltips. See d3-time-format for available options.
-
-
format chart area
-
chart top margin[px]
Set the top margin of the chart, in pixels. height: from 0 to 255(default:60)
-
chart height[px]
Set the chart maximum height of each line, in pixels. height: from 1 to 255(default:60)
-
reset zoom label size[px]/color
Set the font size[in pixels] and font color to reset zoom label. size: from 0 to 64(default:24)
-
-
options
-
enable animations
Set whether to animate transitions.
-
enable date marker(now)
Set whether to display the current date of the vertical line.
-
enable forward input messages
Set whether to forward input messages to output.
-
-
legends
Set the
colorandvalueto be displayed on the chart.
-
-
Input items
An array of Items is passed in by msg.payload. It consists of objects containing the following properties.
[Data syntax]
{
    dataItems:[
        {
            group: "group1name",
            data: [
            {
                label: "label1name",
                data: [
                {
                    timeRange: [<date>, <date>],
                    val: <val: number (continuous dataScale) or string (ordinal dataScale)>
                },
                {
                    timeRange: [<date>, <date>],
                    val: <val>
                },
                (...)
                ]
            },
            {
                label: "label2name",
                data: [...]
            },
            (...)
            ],
        },
        {
            group: "group2name",
            data: [...]
        },
        (...)
    ],
    settings:{
        xAxis:{
            tickFormat: <val: string (date time[default:YYYY-MM-DD HH:mm:ss])>,
            startDateTime: <date>,
            endDateTime: <date>,
            labelsFontSize: <val: number (from 0 to 64[default:16])>
            labelsColor: <val: string (from #000000 to #ffffff[default:#000000])>
        },
        yAxis:{
            labelsFontSize: <val: number (from 0 to 64[default:16])>
            labelsColor: <val: string (from #000000 to #ffffff[default:#000000])>
        },
        tooltips:{
          timeFormat: <val: string (d3-time-format[default:%Y-%m-%d %H:%M:%S])>,
        }
        chart:{
          topMargin: <val: number (from 0 to 255[default:60])>
          height: <val: number (from 1 to 255[default:60])>
          resetZoom:{
              labelFontSize: <val: number (from 0 to 64[default:24])>
              labelColor: <val: string (from #000000 to #ffffff[default:#000000])>
          },
          lineColors <{val: string (from #000000 to #ffffff[default:#000000]), val: string (label name)}>,
        },
        options:{
          enableAnimations: <boolean>,
          enableDateMarker: <boolean>,
          forwardInputMessages: <boolean>
        }
    }
}
priority: (msg.payload.settings > node property settings)
npm-scripts
There are some npm-scripts to help developments.
- npm install - Install the testing environment in your project.
- npm run build - Make
./data/my-nodedirectory from thesrcdirectory and Install the my-node in Node-RED. - npm run start - Start Node-RED.
"http://localhost:1880"
file list
[root]
│  package.json
│  README.md
│  tsconfig.json
│
├─data -> `Node-Red work files`
│  │
│  ├─my-node -> `project files` The resource files and built files should be placed here.
│  │  │  package.json
│  │  │
│  │  └─nodes -> The resource files and built files should be placed here.
│  │     └─...
│  │
│  └─node_modules
│     └─...
│
├─dist -> `The project built files`
├─examples -> `node-RED flow files`
├─figs
└─src
    └─nodes -> project files
        ├─icons
        ├─lib
        ├─locales
        │  ├─en-US
        │  └─ja
        └─test


