Nagios View
a simple CLI dashboard for nagios using the status.dat file
NOTE: as of right now this acts as a "dashboard" - it can only read status.
Examples
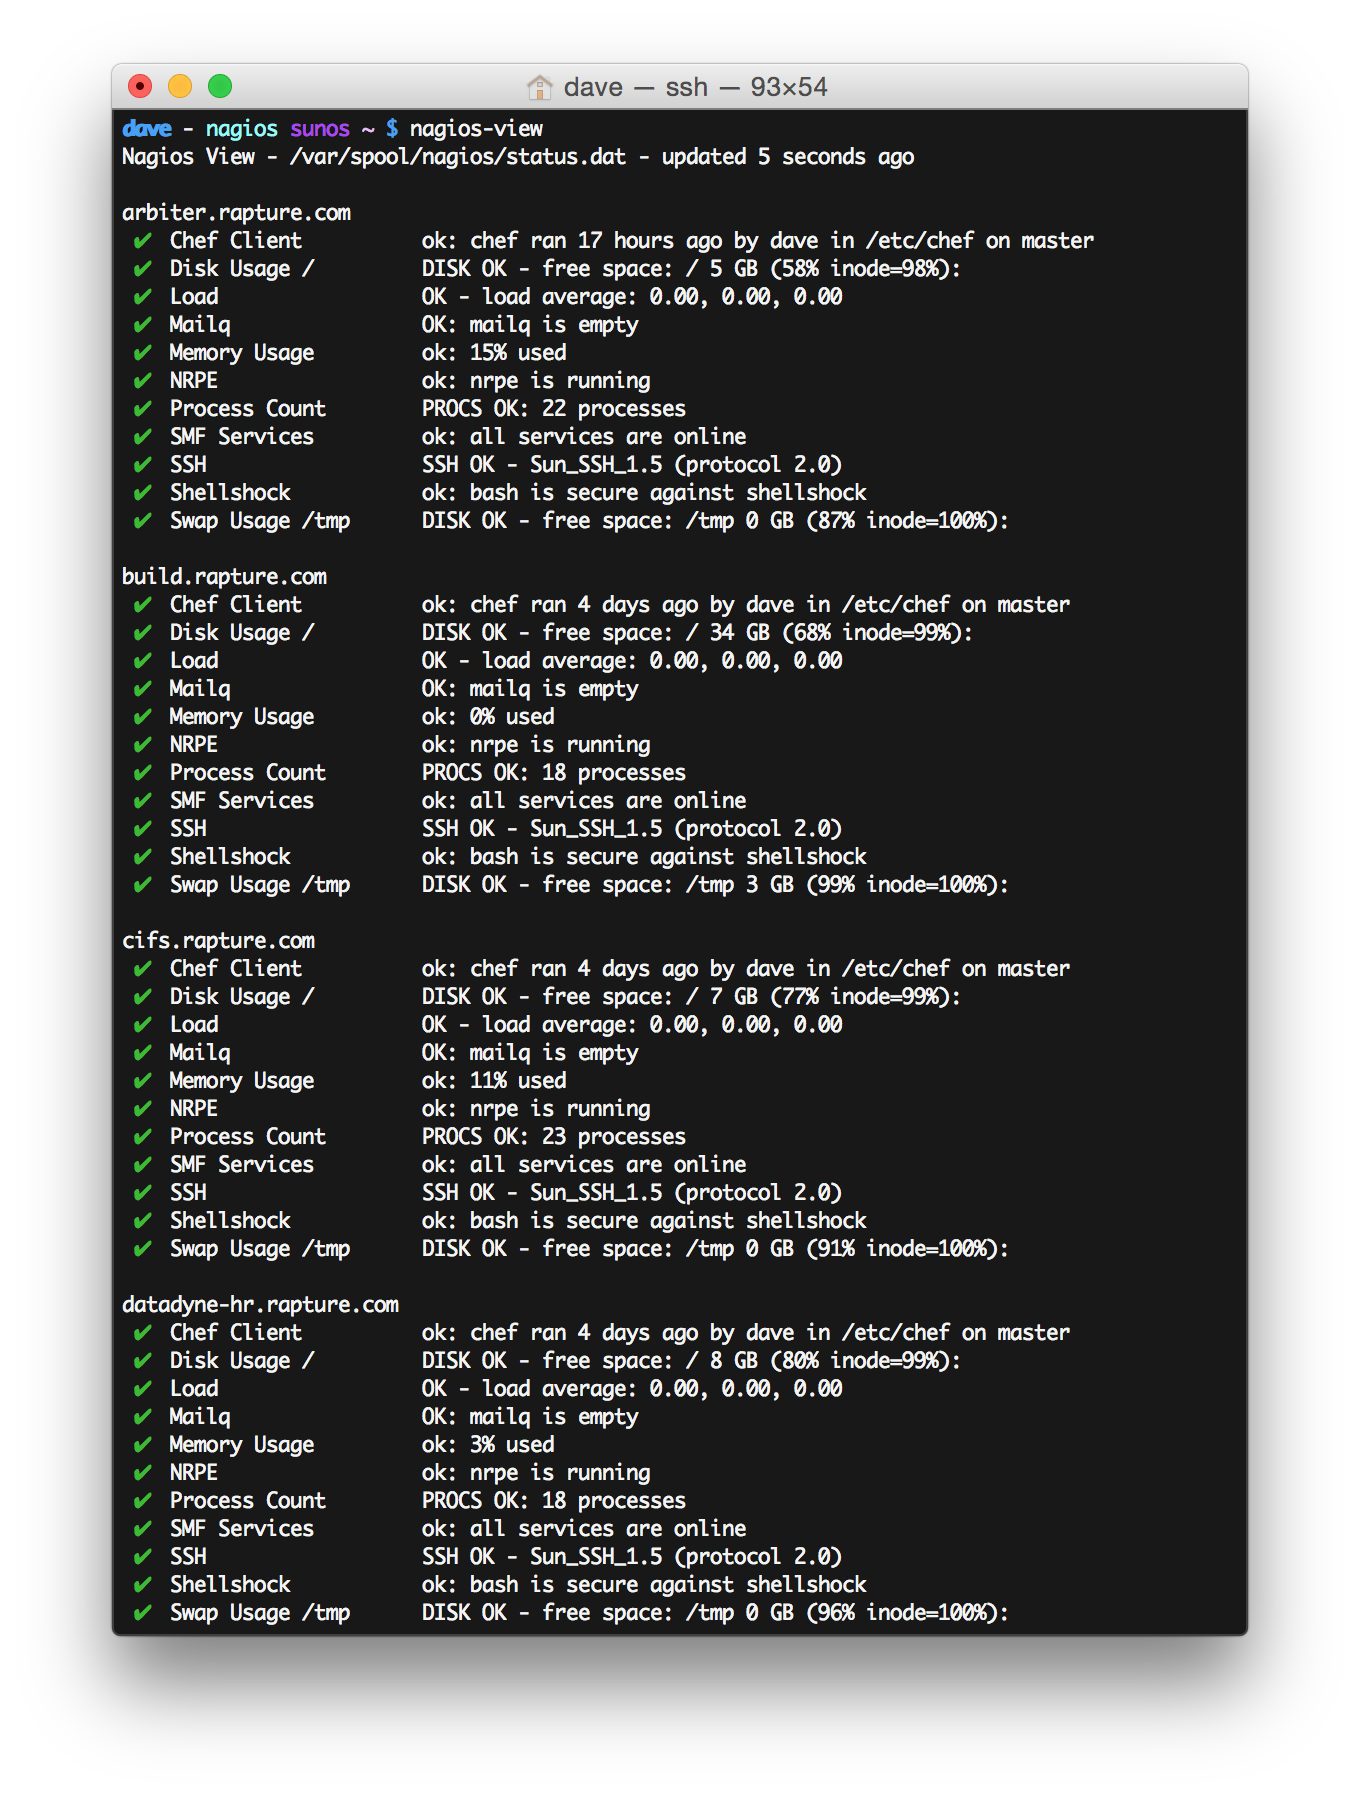
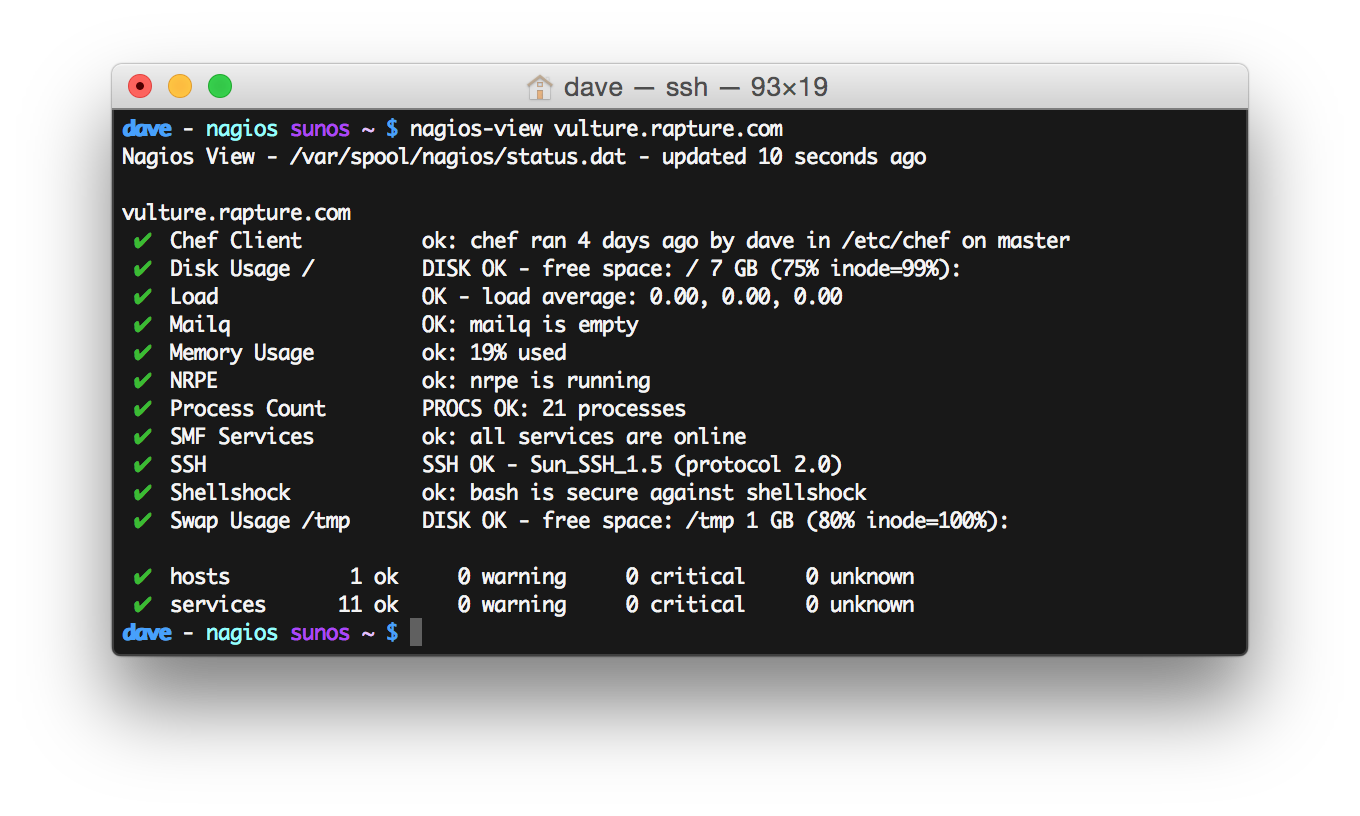
Run nagios-view with no arguments to get a summary of everything in Nagios
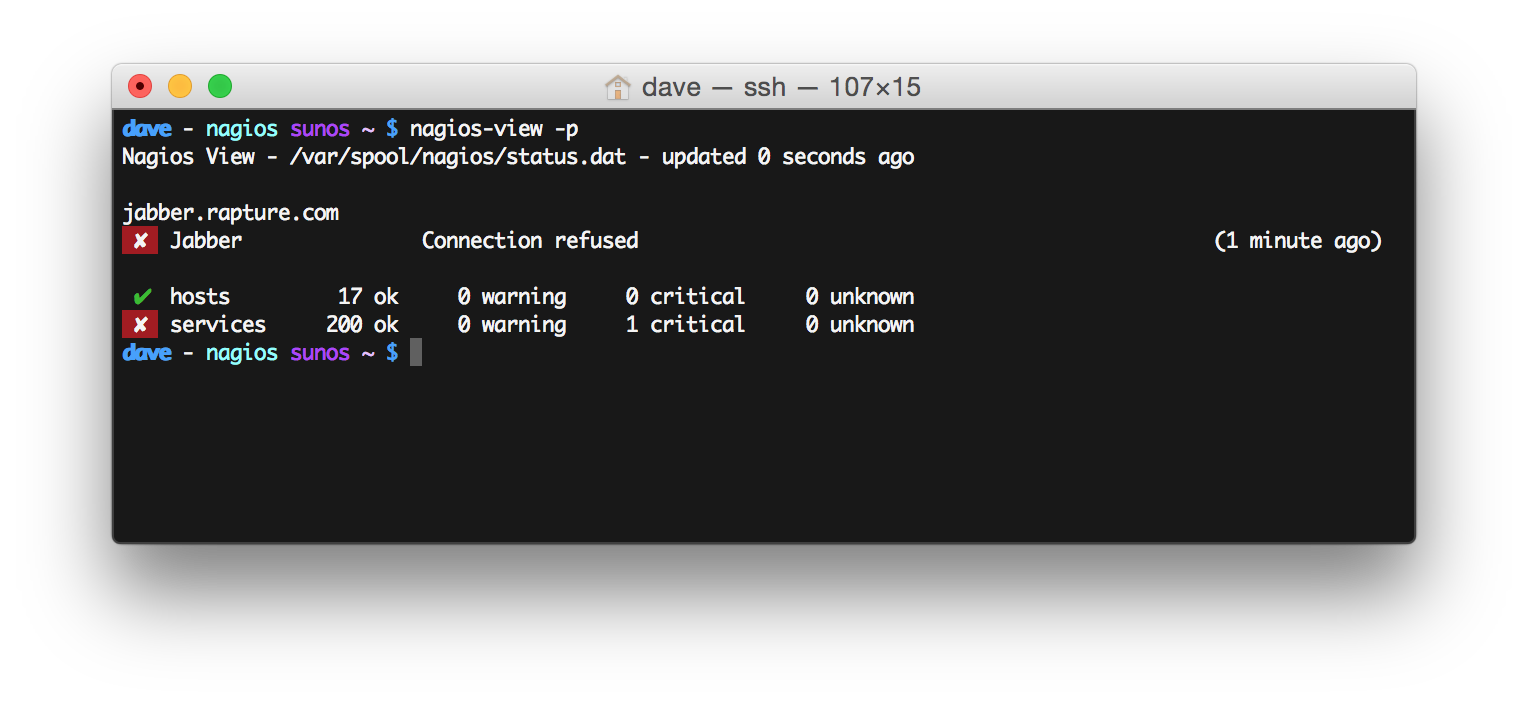
Add -p to only show hosts and services that are "problems" - anything not in the OK state
Anything provided as the first operand will be used to filter by service and hostname (case sensitive)
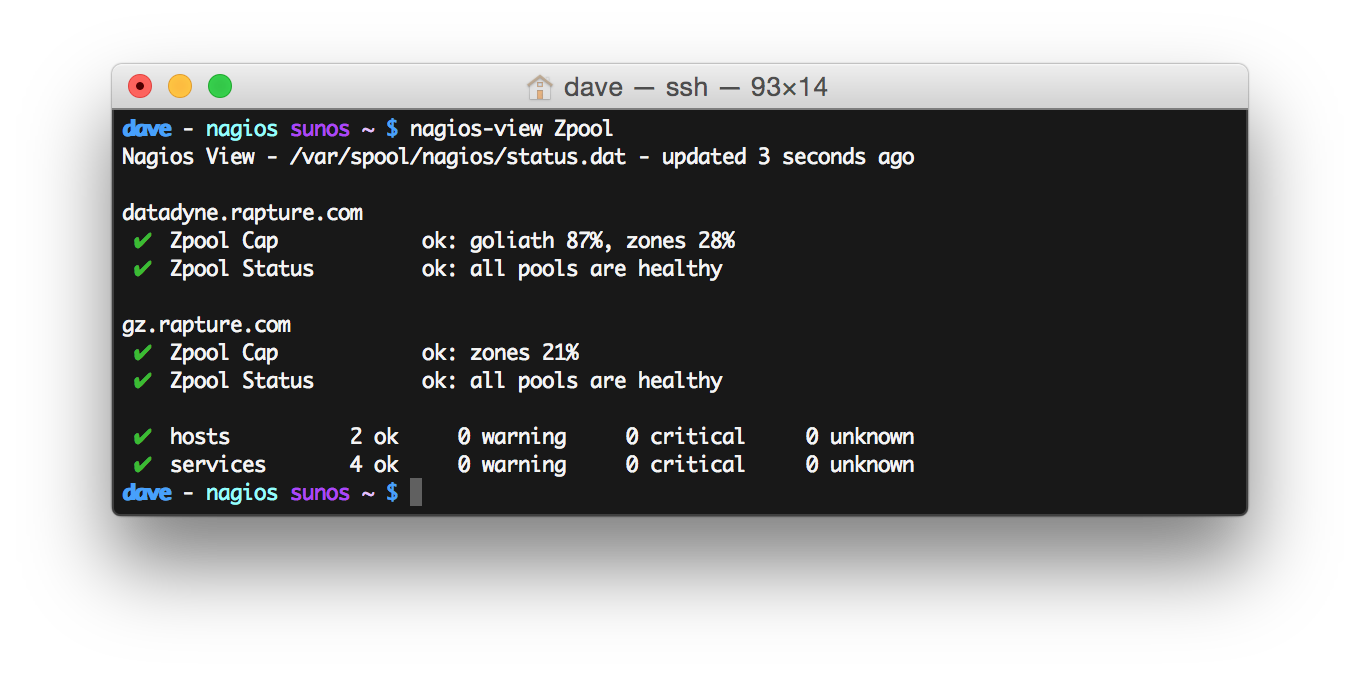
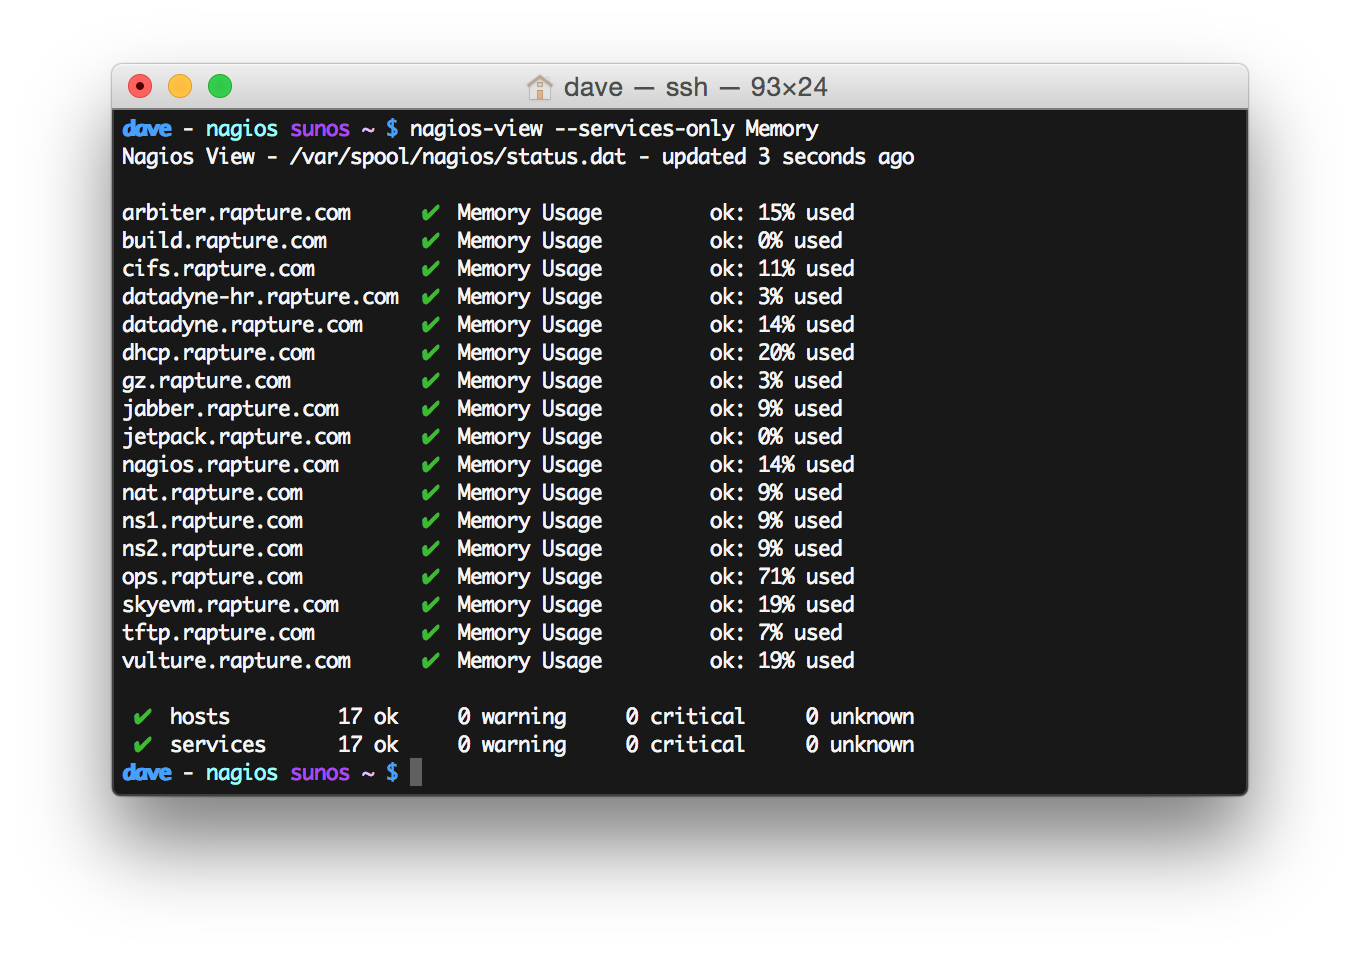
Filter for specific services
Add --services-only to remove breaks for different hosts and to prepend the hostname to the service line
Filter for a specific host
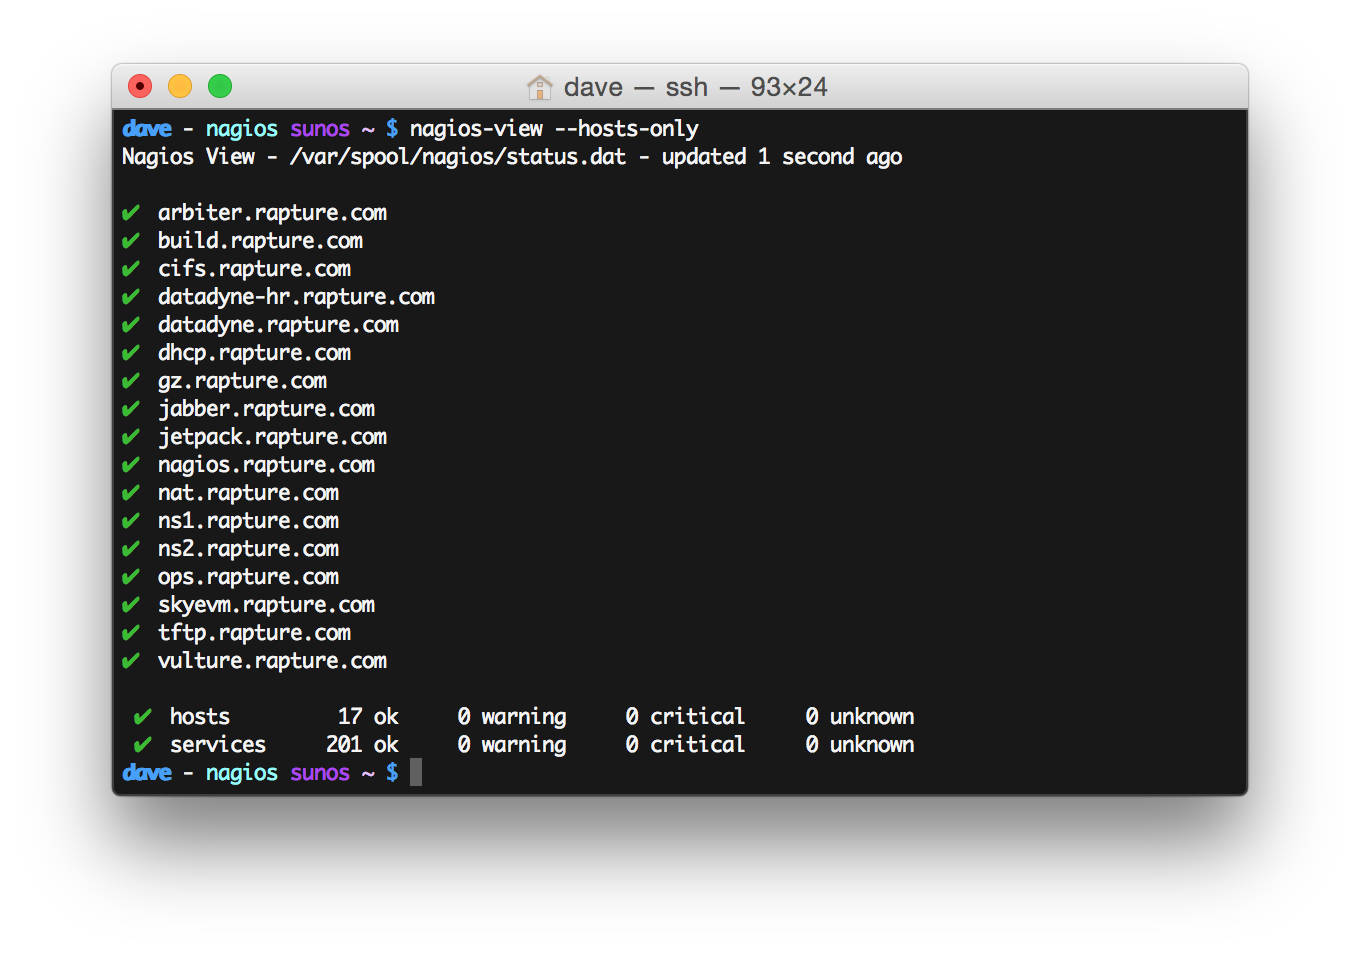
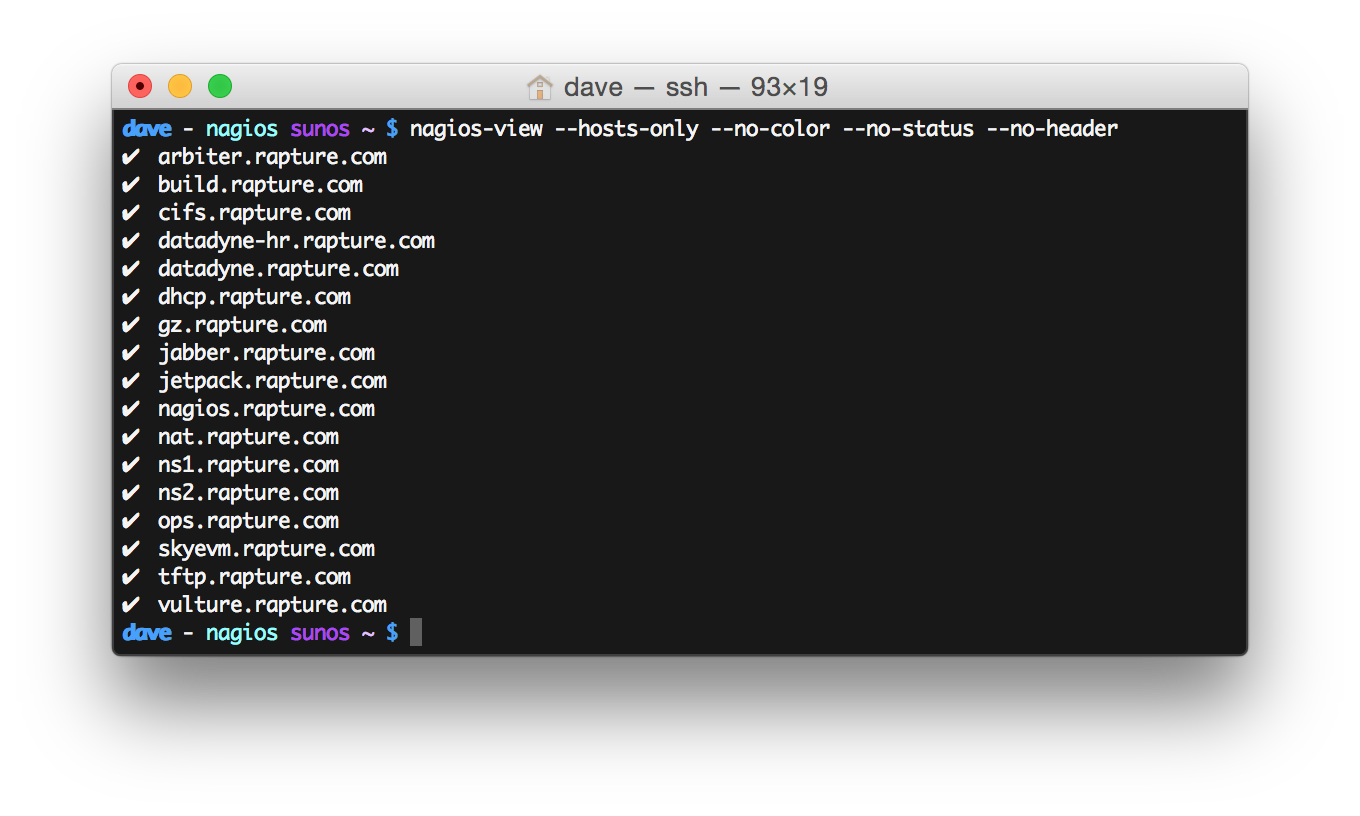
Use --hosts-only to only report on host status
Combine a lot of different arguments to get a custom dashboard
Usage
$ nagios-view -h
usage: nagios-view [-hHnpsw] [-f /path/to/status.dat]

a simple CLI dashboard for nagios using the status.dat file

options
  -f, --file <file>         supply the path to status.dat as <file>, defaults to /var/spool/nagios/status.dat
  -h, --help                print this message and exit
  -u, --updates             check for available updates
  -v, --version             print the version number and exit

  -p, --problems            only show problem services (not OK status)
  -w, --watch               update automatically every 10 seconds indefinitely
      --hide-acknowledged   hide any services that have been acknowledged
      --status-only         only print the status lines at the bottom with totals
      --no-header           don't print header line at the top of the output
      --no-status           don't print status lines at the bottom with totals
      --hosts-only          only print hosts, not services
      --services-only       only print services, not hosts

  color output - defaults to color output if stdout is a TTY
      --color               force color output
      --no-color            disable color output

  state change times - printed by default for only problem services or hosts
      --times               print the time since last state change for all services and hosts
      --no-times            don't print the time since last state change for anything
License
MIT License