mimosa-dependency-graph
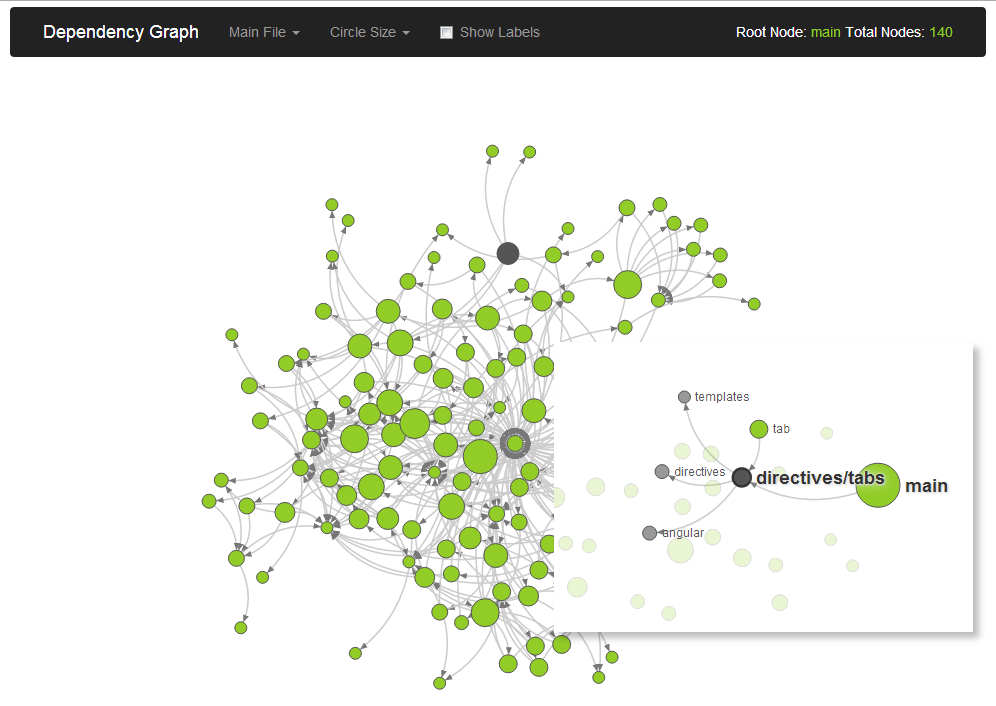
This module will generate a d3 visualization of your application dependency graph.
Overview
mimosa-dependency-graph utilizes the dependency information that Mimosa already exposes via its mimosa-require module to construct a force layout graph in d3.
For more information regarding Mimosa, see http://mimosa.io.
Usage
- Add
'dependency-graph'to the list of modules in your project'smimosa-configfile. - Run
mimosa buildormimosa watch. Mimosa will automatically install the new module for you. - Open the following file in a browser:
<your_project>/.mimosa/dependency_graph/index.html. - Explore!
Note: It is recommended to use Chrome to view the graph, as the SVG rendering becomes considerably slower in Firefox the larger your app gets.
Functionality
When you initially run mimosa build or mimosa watch, the following directory structure will be created at the root of your project, if it does not already exist: .mimosa/dependency_graph. The module will then drop a series of assets into that directory:
.mimosa/dependency_graph
|_ jquery.min.js
|_ bootstrap.min.css
|_ bootstrap.min.js
|_ d3.min.js
|_ d3.chart.min.js
|_ dependency_graph.js
|_ main.css
|_ main.js
|_ index.html
It will also create a data.js file with the dependency data to feed to the graph.
During mimosa watch, if the dependencyGraph.watch.enabled option is set to true, any changes that you make to your scripts will trigger an update of data.js.
Configuration
Default
dependencyGraph:
  assetFolder: ".mimosa/dependency_graph"
  safeAssets: []
  watch:
    enabled: false
assetFolder: This is the folder that Mimosa will place all the dependency graph assets in.safeAssets: You may customize any of the assets by providing your own version. To ensure that Mimosa does not override them, list them out in this array. You only need to list filenames, not paths.watch.enabled: Set this to true if you would like Mimosa to regenerate thedata.jsfile as necessary during a watch.
Example
The following is an example of a project's mimosa-config.coffee in which the dependency-graph module was tossed into the workflow, and custom versions of d3.min.js and main.css were given.
exports.config =
  modules: ['lint', 'server', 'require', 'minify', 'live-reload', 'dependency-graph']
  dependencyGraph:
    safeAssets: ['d3.min.js', 'main.css']
Customization
Feeling the itch to personalize the graph with your own color scheme? As mentioned above, Mimosa gives you the flexibility to override any of the assets that it provides by listing their filenames in the safeAssets config property.
You technically can customize any parts of the graph that you would like. This module uses d3.Chart to define a DependencyGraph chart type, so you can easily change or extend the chart's functionality. See https://github.com/misoproject/d3.chart/wiki/chart-extend for details.
However, this module makes no guarantee that future versions will be backward-compatible. If there's a feature you'd really like to see baked into mimosa-dependency-graph, it may be best to contribute back to the project itself!