LineChart
Line chart generator for markvis in browser and node.js.


![]()
![]()
Install
npm install markvis-line --save or use yarn yarn add markvis-line --saveUsage
const markvisLine = ;const line = Check out the example for usage.
Output the visualization result to a image
npm run example
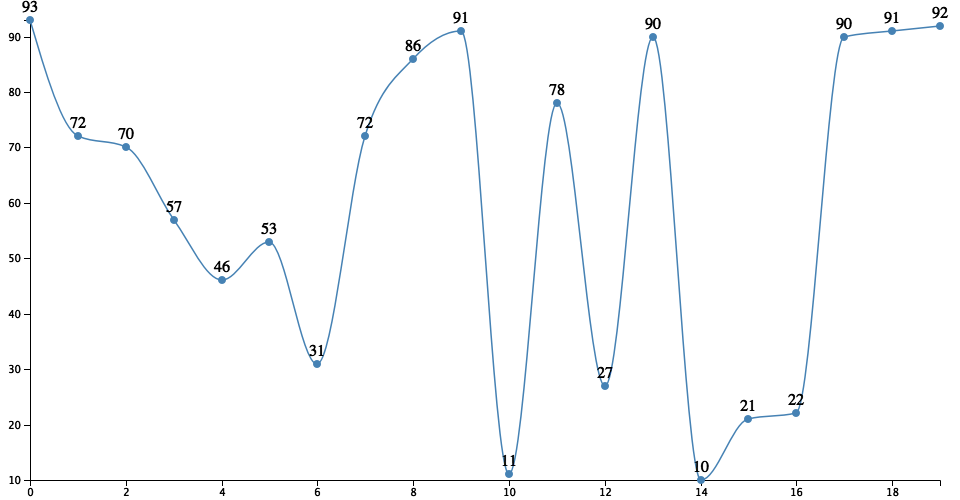
Output Preview (png):
API
markvisLine({ data, d3, d3node[, selector, container, style] })
options
data
- Type:
Array
Data from file or web processed by d3 library.
d3
- Type:
Object
d3 library which used in browser environment.
d3node
- Type:
Object
d3-node constructor which used in node environment.
selector
- Type:
String - Default:
'#chart'
DOM selector in container.
container
- Type:
String - Default:
<div id="container"><h2>Line Chart</h2><div id="chart"></div></div>
DOM contained the visualization result.
style
- Type:
String - Default:
''
Line chart style.
width
- Type:
Number - Default:
960
SVG width for line chart.
height
- Type:
Number - Default:
500
SVG height for line chart.
responsive
- Type:
boolean - Default:
false
Whether the chart should be automatically resized to fit its container. If true, width and height options are used for the initial sizing/SVG viewBox size.
margin
- Type:
Object - Default:
{ top: 20, right: 20, bottom: 20, left: 30 }
Margin of the first wrapper in SVG, usually used to add axis.
lineWidth
- Type:
Number - Default:
1.5
Width of line.
lineColor
- Type:
string - Default:
steelblue
Color of line.
showXAxis
- Type:
boolean - Default:
true
Whether to show the X axis.
showYAxis
- Type:
boolean - Default:
true
Whether to show the Y axis.
showValues
- Type:
boolean - Default:
true
Whether to show values above each point.
showDots
- Type:
boolean - Default:
true
Whether to show dots at each point.
dotAttrs
- Type:
Object - Default:
{}
Attributes set on each dot element (only if showDots is true).
isCurve
- Type:
boolean - Default:
true
Whether the line chart is curve.
export
- Type:
boolean - Default:
false
Whether to export to a PNG image.
Contributing
- Fork it!
- Create your feature branch:
git checkout -b my-new-feature - Commit your changes:
git commit -am 'Add some feature' - Push to the branch:
git push origin my-new-feature - Submit a pull request :D
LICENSE
markvis-line © geekplux, Released under the MIT License.
Authored and maintained by geekplux with help from contributors (list).
geekplux.com · GitHub @geekplux · Twitter @geekplux