![]()
MapMagic GL
Map GL Library สำหรับการใช้งานแผนที่ดิจิตอลบนเว็บไซต์ด้วย Javascript มีฟังก์ชันรองรับการแสดงผล และ Interaction บนแผนที่ พร้อมกับ Map Style ที่มีให้เลือกใช้กว่า 10 แบบ
Official Site : https://www.mapmagic.co.th
For Developers : https://developers.mapmagic.co.th สำหรับจัดการ API Key และรับสิทธิ์การเข้าถึง MapMagic บน Application ของคุณ
ดูตัวอย่างเพิ่มเติมได้ที่: DEMO
📣 Upcoming Releases
- ปรับปรุงฟังก์ชัน addLine และ addMarker
- แก้ไขรูปทรงของ line และ polygon ได้
- ฟังก์ชัน getMarker
- Snippets
📌 Release Notes 1.2.5-rc.1
- แก้ให้ overlay แสดงเมื่อมีการ scroll
- แก้ไข logger ใช้งานไม่ได้
📋 Features
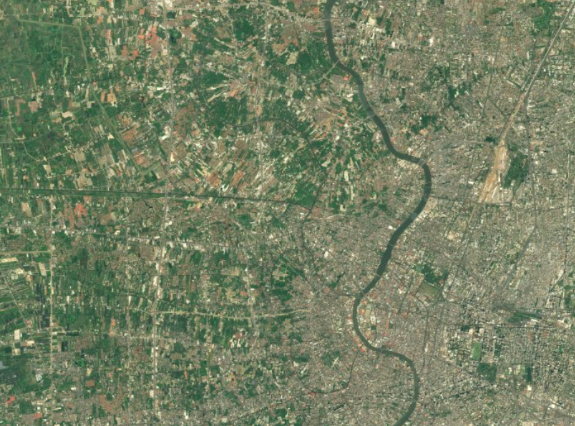
- แสดงแผนที่บนเว็ปไซต์
- การกำหนดการแสดงภาษาบนแผนที่
- Map Style
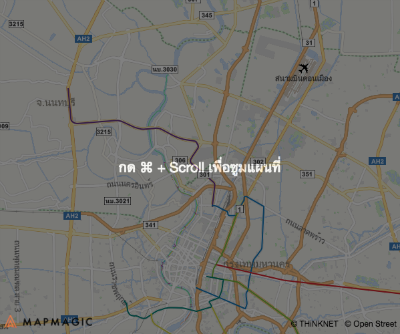
- Scroll protection
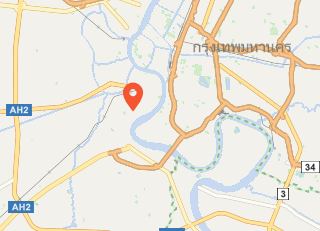
- Marker
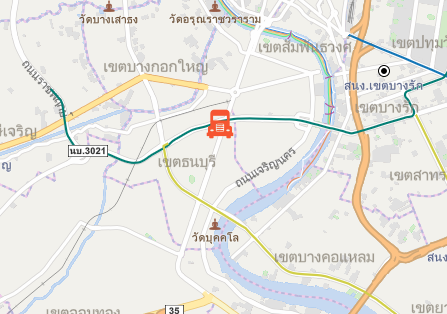
- Geometry
- API Document
📥 ติดตั้ง MapMagic GL
ติดตั้งผ่าน NPM
ติดตั่ง dependencies
$ npm install mapmagic-gl --saveจากนั้น import mapmagic-gl เข้าสู่โปรเจค
const MapmagicGL = หรือดาวน์โหลดจาก MapMagic Server สำหรับใช้บน HTML
🔌 เริ่มใช้งาน MapMagic API
เริ่มต้นสร้างแผนที่
สร้าง div สำหรับเป็นพื้นที่ให้ render map ลงบนหน้าเว็ป และก่อนที่จะใช้ MapMagic คุณต้องทำการสร้าง app_id และ api_key จาก MapMagic Platform
เพื่อนำมาใช้งานกับแผนที่ของคุณ
ชื่อของ container จะต้องตรงกับ id ของ div ที่ใช้แสดงแผนที่ และคุณก็สามารถใช้ชื่อ container อื่นๆได้เช่นกัน
MapMagic initial options
| Property | Description | Type | Default |
|---|---|---|---|
| container | id ของ container ที่จะใช้ render map | string | map |
| app_id | Application ID ของคุณ | string | - |
| api_key | API Key ของคุณ | string | - |
| center | จุดเริ่มต้นของแผนที่ | object | { lng: 100.49, lat: 13.72 } |
| zoom | ระดับการซูมขณะเริ่มแผนที่ จะต้องอยู่ระหว่าง 1 - 22 | integer | 9 |
| navigationCtrl | แสดงแถบปรับมุมมองของแผนที่ | boolean | false |
| protectScroll | ป้องกันการเลื่อนโดนแผนที่ | boolean | false |
การเรียกใช้ฟังก์ชันแผนที่ ทุกฟังก์ชันจะต้องเรียกหลังจากที่แผนที่ load เสร็จแล้ว ด้วยการเรียกฟังก์ชันใน map.on('load', function...) ดังนี้
mapMap style
รายชื่อ Map Style
เปลี่ยน Map Style
สามารถเปลี่ยน Map Style ได้ 2 ทาง คือ
ผ่านทาง Initial map
const map = container: 'map' // div's id for render map app_id: 'YOUR_APP_ID' api_key: 'YOUR_API_KEY' style: 'MAP_STYLE'ผ่านทางฟังก์ชั่น setStyle
mapProtected Scrolling
const map = container: 'map' app_id: 'YOUR_APP_ID' api_key: 'YOUR_API_KEY' protectScroll: true;Marker
map.addMarker(options)
| Property | Description | Type | Default |
|---|---|---|---|
| id | ระบุ id ให้แต่ละ marker ( ห้ามซ้ำเด็ดขาด ) | string | (Random ID) |
| lat | latitude ของ Marker | number | - |
| lng | longitude ของ Marker | number | - |
| offset | ระยะห่างของ icon กับพิกัดของ Marker | number[] | [0, 0] |
| onClick | event ที่จะเกิดขึ้นเมื่อผู้ใช้ click | function | - |
| icon | เปลี่ยน icon | string | - |
| draggable | ทำให้ Marker สามารถลากวางได้ | boolean | false |
| onDragEnd | event ที่จะเกิดขึ้นเมื่อผู้ใช้ drag เสร็จสิ้น | function | - |
| popup | แสดง Popup บน Marker | object | - |
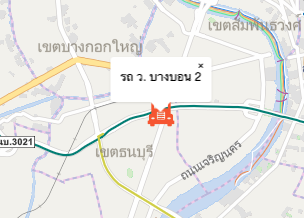
เพิ่ม Marker ลงบนแผนที่
mapIcon Marker
mapDraggable Marker
mapmap.addMarker(options) กับ Popup
| Property | Description | Type | Default |
|---|---|---|---|
| description | คำอธิบายเมื่อ popup แสดงขึ้น | string | - |
| action | เมื่อ action นี้ถูกเรียก popup จะแสดง มี 2 รูปแบบคือ click และ hover |
string | click |
| offset | ระยะห่างของ popup กับพิกัดของ Marker | number[] | [0, 0] |
เพิ่ม Popup ลงใน Marker
mapmap.setMarker(options) ปรับตำแหน่ง Marker
| Property | Description | Type | Default |
|---|---|---|---|
| id | id ของ Marker ที่ต้องการ update ค่า | string | - |
| lat | latitude ของ Marker | number | - |
| lng | longitude ของ Marker | number | - |
ตัวอย่าง
HTML
บางนา บางมด บางบอนjavascript
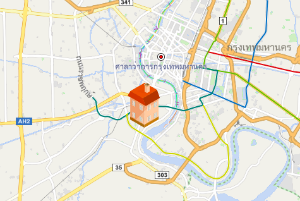
mapmap.addMarkerImage(options) เพิ่ม Marker ที่เป็นรูปภาพ
| Property | Description | Type | Default |
|---|---|---|---|
| url | URL รูปภาพ | string | - |
mapGeometry
map.addLine(options) วาดเส้นลงแผนที่
| Property | Description | Type | Default |
|---|---|---|---|
| id | ระบุ id ให้แต่ละ Line (ห้ามซ้ำเด็ดขาด) | string | (random id) |
| coordinates | Array ของพิกัดแต่ละจุด (เพื่อที่จะวาดเส้นต้องมีมากกว่า 1 จุด) | array(number[]) | - |
| style | รูปแบบของเส้น | object | - |
Line style
| Property | Description | Type | Default |
|---|---|---|---|
| lineWidth | ความหนาของเส้น | number | - |
| color | สีของเส้น | string | - |
ตัวอย่างการวาดเส้น โดยการเพิ่มตำแหน่ง (lng, lat) ลงใน Array อย่างเป็นลำดับ
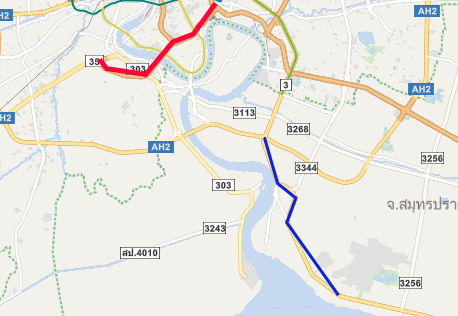
mapmap.addPolygon(options) วาด Polygon
| Property | Description | Type | Default |
|---|---|---|---|
| id | ระบุ id ให้แต่ละ Polygon (ห้ามซ้ำเด็ดขาด) | string | (random id) |
| coordinates | Array ของพิกัดแต่ละจุด (เพื่อที่จะวาด Polygon ต้องมีมากกว่า 2 จุด) | array(number[]) | - |
วาด Polygon โดยการเพิ่มตำแหน่ง (lat, lng) ลงใน Array อย่างเป็นลำดับ
map💡 Code ตัวอย่าง
DEMO