loess
JavaScript implementation of the Locally-Weighted Regression package originally written in C by Cleveland, Grosse and Shyu (1992)
Getting started
First install the package:
npm install loess --save
Load in your data:
var data = Instantiate a LOESS model with the data:
var Loess = var options = span: 05 band: 08 degree: 1var model = data optionFit model by calling the .predict( ) method on the model object:
var fit = modelconsole// do something else with fit.fittedTo fit model on a new set of points, pass a data object into .predict( )
var newData = x: 1 2 3 4 5 x2: 6 7 8 9 10 fit = model var upperLimit = fitfittedvar lowerLimit = fitfitted// plot upperLimit and lowerLimitAlternatively, use .grid( ) method to generate a grid of equally spaced points:
newData = model fit = modelUsage
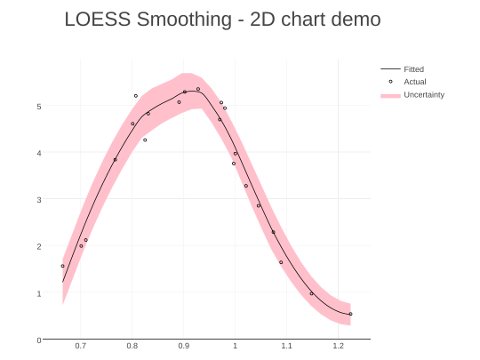
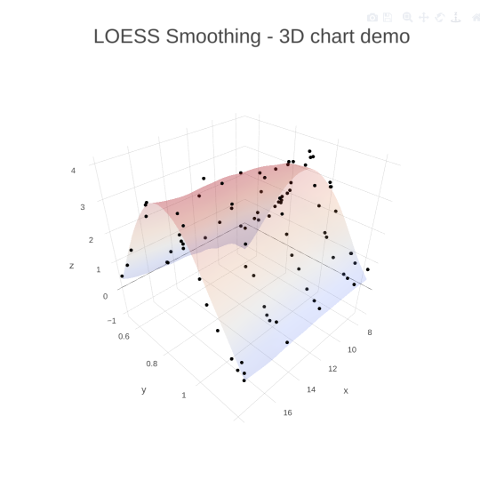
Find out more by visiting my demo app:
Documentation
{ // arguments data /*required*/ = y: number x: number x2: number // optional w: number // optional options /*optional*/ = span: number // 0 to inf, default 0.75 band: number // 0 to 1, default 0 degree: 0 1 2 || 'constant' 'linear' 'quadratic' // default 2 normalize: boolean // default true if degree > 1, false otherwise robust: boolean // default false iterations: integer //default 4 if robust = true, 1 otherwise // return a LOESS model object with the following properties thisy = datay thisx = datax datax2 // predictor matrix thisn = thisylength // number of data points thisd = thisxlength // dimension of predictors thisbandwidth = optionsspan * thisn // number of data points used in local regression thisoptions = options } { // arguments data /*optional*/ = x: number x2: number // default this.x return fitted: number // fitted values for the specified data points halfwidth: number // fitted +- halfwidth is the uncertainty band } { return x_cut: number // equally-spaced data points x_cut2: number x: number // all combination of x_cut and x_cut2, forming a grid x2: number }Note:
- data should be passed into the constructor function as json with keys y, x and optionally x2 and w. Values being the arrays of response, predictor variables, and observation weights.
- If no data is supplied to .predict( ) method, default is to perform fitting on the original dataset the model is constructed with.
- span refers to the percentage number of neighboring points used in local regression.
- band specifies how wide the uncertainty band should be. The higher the value, the greater number of points encompassed by the uncertainty band. Setting to 0 will return only fitted values.
- By default LOESS model will perform local fitting using the quadratic function. Overwrite this by setting the degree option to "linear" or "constant". Lower degree fitting function computes faster.
- For multivariate data, normalize option defaults to true. This means normalization is applied before performing proximity calculation. Data is transformed by dividing the factors by their 10% trimmed sample standard deviation. Turn off this option if dealing with geographical data.
- Set robust option to true to turn on iterative robust fitting procedure. Applicable for estimates that have non-Gaussian errors. More iterations requires longer computation time.
- When using .grid( ), cuts refers to the number of equally spaced points required along each axis.
Credits
William S. Cleveland, Susan J. Devlin
Locally Weighted Regression: An Approach to Regression Analysis by Local Fitting
Journal of the American Statistical Association, Vol. 83, No. 403. (Sep., 1988), pp. 596-610.
William S. Cleveland, Eric Grosse, Ming-Jen Shyu
A Package of C and Fortran Routines for Fitting Local Regression Models (20 August 1992)
Source code available at http://www.netlib.org/a/dloess