leaflet.axesgrid

0.0.4 • Public • Published

Leaflet Axes Grid

You can use layer coords based grid and axes lines with labels, Useful for floorplan or drawings
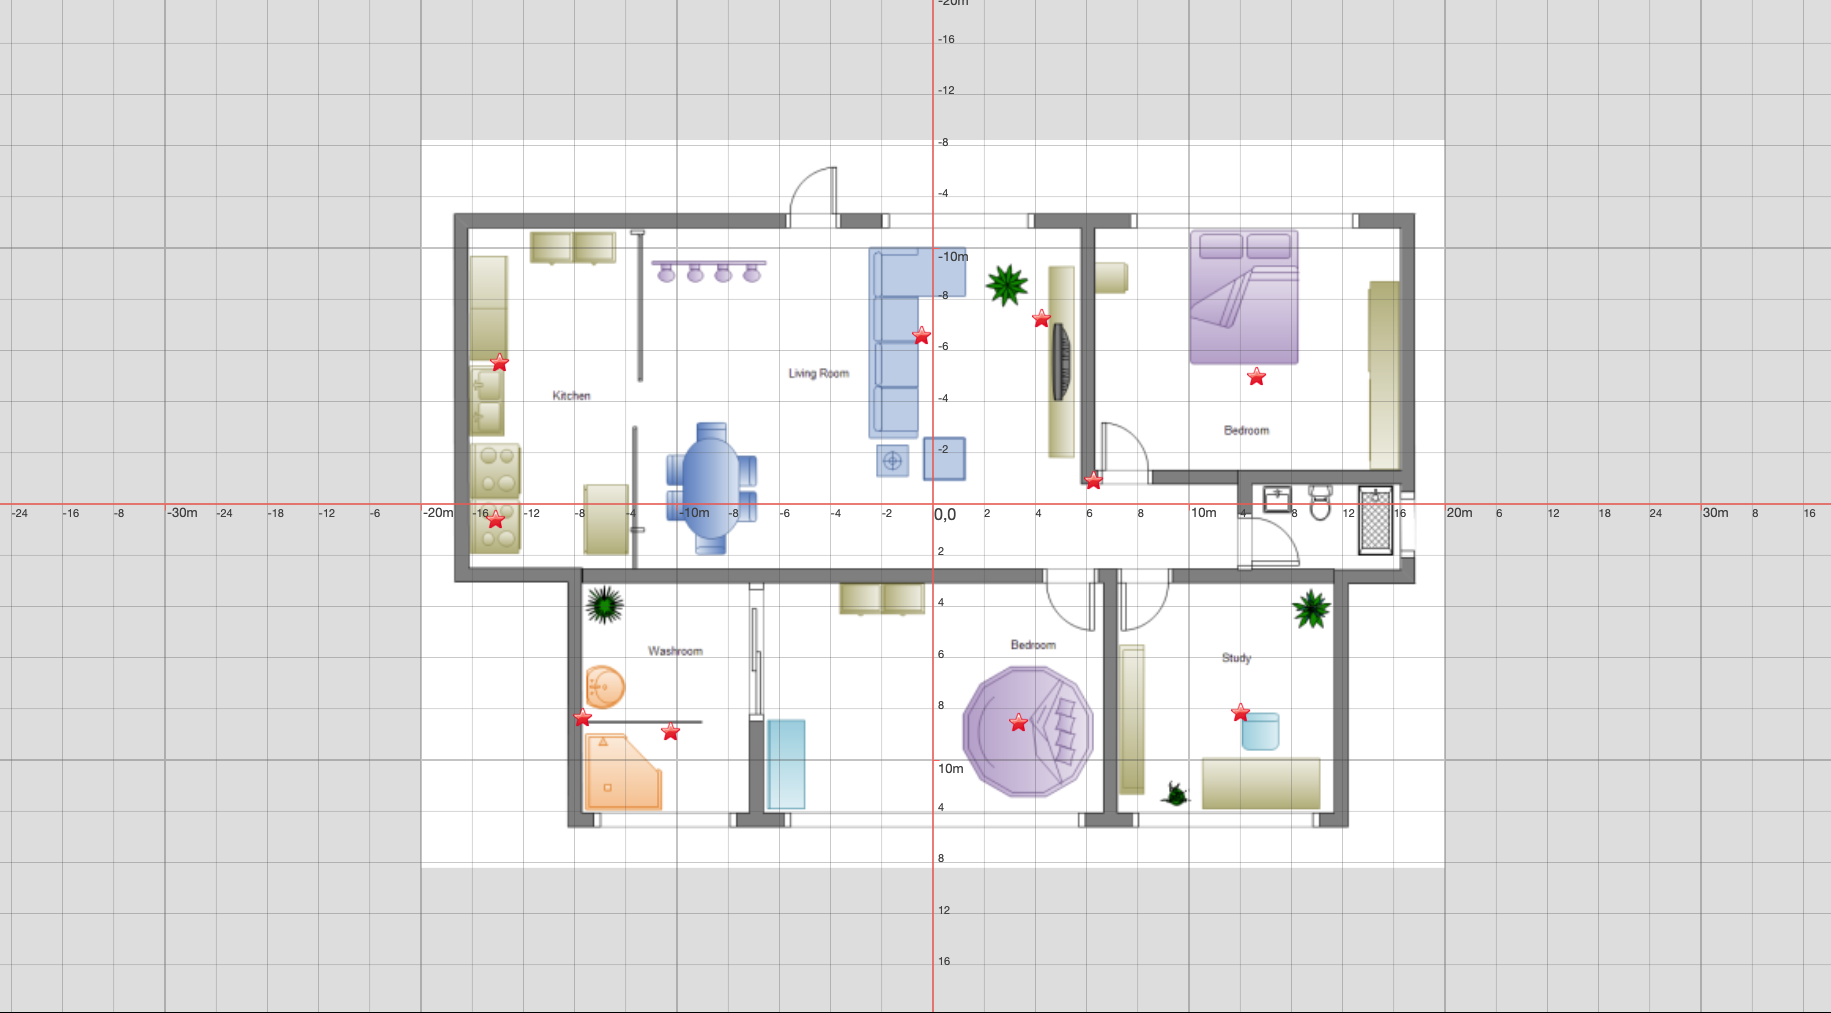
Check out the demo. Example

Usage example

L.axesGrid({
    cells:5,
    showLabel:true,
    label: {
        scale: 1,
        unit: 'm',
        color: '#404040',
        size: 13
    }
}).addTo(map);

Options

  • cells: Number of cells in one single grid's row. Default 5
  • showLabel: Show the axes lines label. Default false
  • label: Is used when showLabel is true
  • color: The color of the grid lines. Default #40404044
  • axesColor: Color of Axes Lines. Default #ff6754
  • axesWidth: Width of Axes Lines. Default 0.8
  • zoom: zoom level for matching scales for measurement

Dependencies (0)

    Dev Dependencies (0)

      Package Sidebar

      Install

      npm i leaflet.axesgrid

      Weekly Downloads

      119

      Version

      0.0.4

      License

      MIT

      Unpacked Size

      70.8 kB

      Total Files

      5

      Last publish

      Collaborators

      • imudin07