

leaflet-vega
Leaflet layer based on Vega visualization grammar
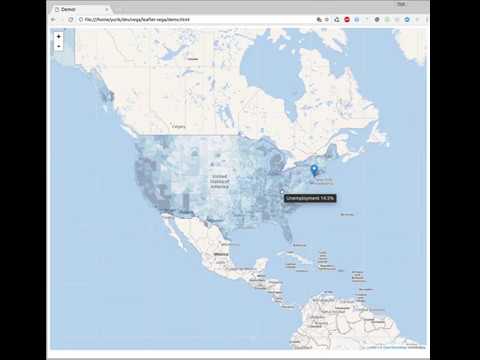
This Leaflet plugin adds a Vega layer on top of the map, and provides two way signaling between Leaflet and Vega. This way a complex Vega-based visualization can be added to a map without any additional JavaScript.
Getting started
- Clone the repo
- open
demo/demo.htmlfile directly in your browser. No server is needed.
Usage (code)
const map = L.map('map');
// Optionally, add a base layer
L.tileLayer('https://maps.wikimedia.org/osm-intl/{z}/{x}/{y}.png', {
attribution: '© <a href="http://osm.org/copyright">OpenStreetMap</a> contributors'
}).addTo(map);
// Add a Vega graph to the map
L.vegaLayer(vegaGrapSpec).addTo(map);Optionally, provide additional parameters to vegaLayer():
-
vega- custom instance of Vega library -
parseConfig- Config to be passed to the Vega parse method -
parseOptions- Options to be passed to the Vega parse method -
viewConfig- Config to be passed ot the Vega View constructor
Usage (Vega spec)
Your Vega spec may read latitude, longitude, and zoom signals, as well as set new values to them, e.g. if you need to change zoom level dynamically. Additionally, you may use setMapView() expression function to modify all of them at once. For example, if you have a set of regions on a map, and clicking the region should center the map, you can use this code (see demo file):
"on": [{
  "events": "@region:click",
  "update": "setMapView(geoCentroid(null, datum))"
}]
The setMapView() can be used in any of these forms:
setMapView(latitude, longitude);         // center
setMapView(latitude, longitude, zoom);   // center and zoom
setMapView([longitude, latitude]);       // center with single array arg
setMapView([longitude, latitude], zoom); // center and zoom
setMapView([[lng1, lat1],[lng2, lat2]]); // bounding box center and zoom
All Vega specs are pre-populated with the following template. Your Vega graph may use any of the signals and the projection directly without declaring them, just like you use width or height signals.
{
  "padding": 0,
  "autosize": "none",

  // If true, graph will be repainted only after the map has finished moving
  // When false, map move is not as smooth, but it allows some visual elements
  // to stay in one place - such as the legend.
  "delayRepaint": true,

  // These signals are two-way bound with Leaflet
  // A vega spec may alter the declaration to update signal value when needed
  // For example, your spec may override zoom/lat/long definition to control map position:
  //    {"name": "zoom", "on": ..., "update": ...}
  "signals": [
    {"name": "zoom"},
    {"name": "latitude"},
    {"name": "longitude"}
  ],

  // For convenience, this preset projection is injected if not defined by the user.
  "projections": [
    {
      "name": "projection",
      "type": "mercator",
      // 256 is the tile size in pixels. The world width is (256 * 2^zoom)
      // d3 mercator scaling is (world / 2 / PI)
      "scale": {"signal": "256*pow(2,zoom)/2/PI"},
      "rotate": [{"signal": "-longitude"}, 0, 0],
      "center": [0, {"signal": "latitude"}],
      "translate": [{"signal": "width/2"}, {"signal": "height/2"}],
      "fit": false
    }
  ]
}