
LDD3
Description
Yes, it is exactly what you think: another charting library based on d3.
This one was built using d3 v4 and TypeScript.
This is currently work in progress (like, really), but I hope some people can find it useful, to see how d3 and typescript can be used, or simply just want to throw some charts on a page without having to deal with the whoe d3 stack.
Being from the .NET world, I used an OOP style for creating the controls and charts, based on class syntax.
Installing
To install ldd3 and get started, simply issue
npm install --save ldd3
Library structure
The library currently comprises two types of controls:
Axes
Charts
All the examples below are extracted from my taking part to the Makeover Monday challenge. Code used to generate these charts is available in this repository.
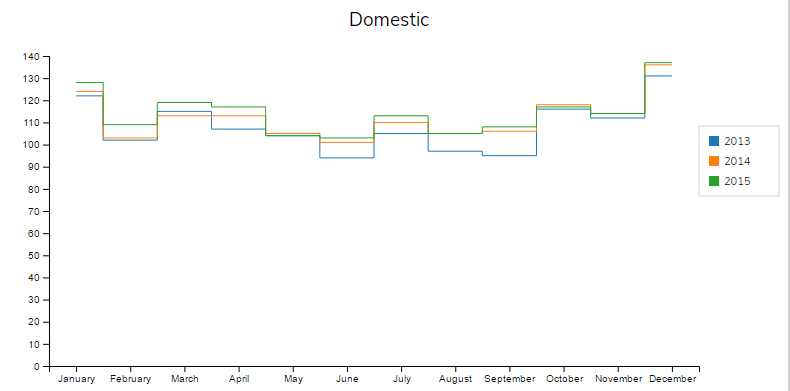
CategoricalLinearChart
A chart with categories on the x-axis and a linear y-axis.
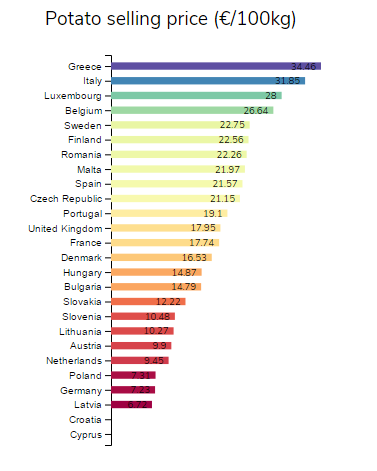
HorizontalBarChart
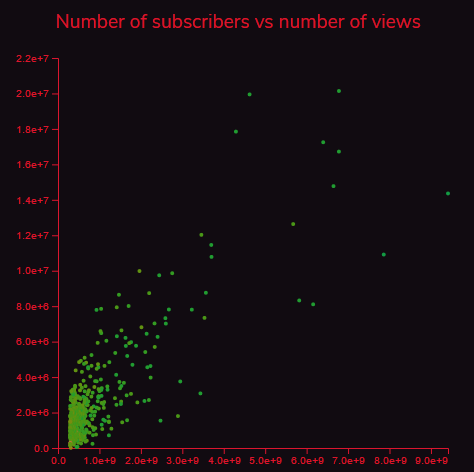
LinearLinearChart
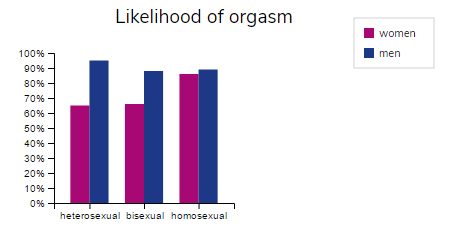
MultiCategoricalChart
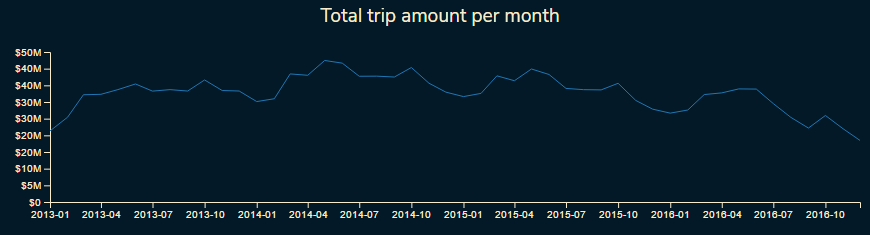
TimeLinearChart
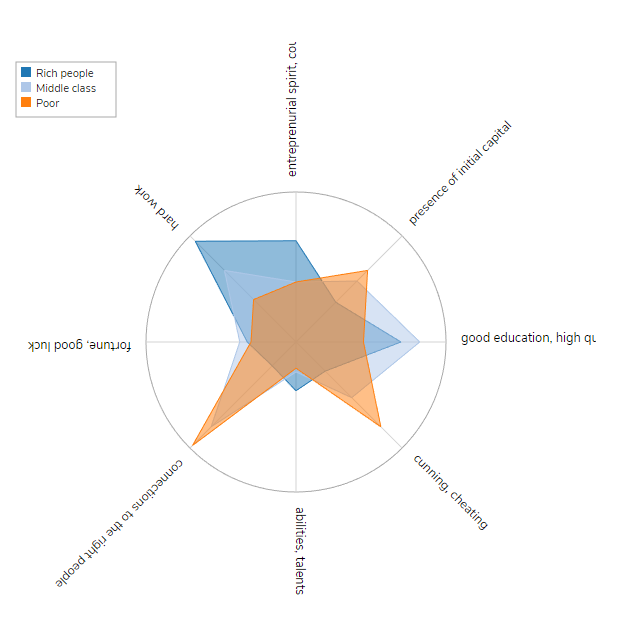
SpiderChart
Spider chart
Usage
I will try to motivate myself to publish some bl.ocks demonstrating how to use these charts. Check this repository for examples in the meanwhile.
API usage is described in the wiki.