Grafana Dash Gen
A collection of utility classes to construct and publish grafana graphs. The library is built ground up to incorporate grafana terminologies.
- Dashboard: Represents the final dashboard that is displayed.
- Row: A row in grafana. Dashboard consists or many rows.
- Panel: A visual display item. A panel could be a graph, single stat or others. A row consists of many panels.
- Target: A dot separated graphite string. E.g, a.b.count. A Panel consists of many targets.
- Annotations: Lined markers that will annotate a graph (panel). A Dashboard can have annotations added to it.
- Templates: Variables that can be included in the state. E.g, a.$dc.b.count (to switch between datacenters). A Dashboard can have templates added to it.
Code to generate the dashboard
You will be able to generate and publish a grafana graph using the following steps.
Step 1: Configure grafana
if you would like grafana to publish your dashboard you need this step. If you do not need grafana to publish your dashboard, you can skip this step.
const grafana = require('grafana-dash-gen');
const Row = grafana.Row;
const Dashboard = grafana.Dashboard;
const Panels = grafana.Panels;
const Target = grafana.Target;
const Templates = grafana.Templates;
const Alert = grafana.Alert;
const Condition = grafana.Condition;

grafana.configure({
	url: 'https://your.grafana.com/elasticsearch/grafana-dash/dashboard/',
	cookie: 'auth-openid=someidhere'
});
Step 2: Create a dashboard
const dashboard = new Dashboard({
	title: 'Api dashboard'
});
(or) Below is an example of a dashboard with a custom slug, templates dc and smoothing and annotations.
 const dashboard = new Dashboard({
 	title: 'Api dashboard',
 	slug: 'api',
 	templating: [{
 		name: 'dc',
 		options: ['dc1', 'dc2']
 	}, {
 		name: 'smoothing',
 		options: ['30min', '10min', '5min', '2min', '1min']
 	}],
 	annotations: [{
 		name: 'Deploy',
 		target: 'stats.$dc.production.deploy'
 	}]
 });
If you do not wish to have any templates and annotations
Step 3: Create a new row
As said abolve, grafana dashboard contains a number of rows.
const row = new Row();Step 4: Create graphs to add to the row
There are two ways to add the graph to a row. Pass it while a graph is created as below
const panel = new Panels.Graph({
	title: 'api req/sec',
	span: 5,
	targets: [
		new Target('api.statusCode.*').
					transformNull(0).sum().hitcount('1seconds').scale(0.1).alias('rps')
	],
	row: row,
	dashboard: dashboard
});
(or) add it in a separate step
const panel = new Panels.Graph({
	title: 'api req/sec',
	span: 5,
	targets: [
		new Target('api.statusCode.*').
					transformNull(0).sum().hitcount('1seconds').scale(0.1).alias('rps')
	]
});
row.addPanel(panel);
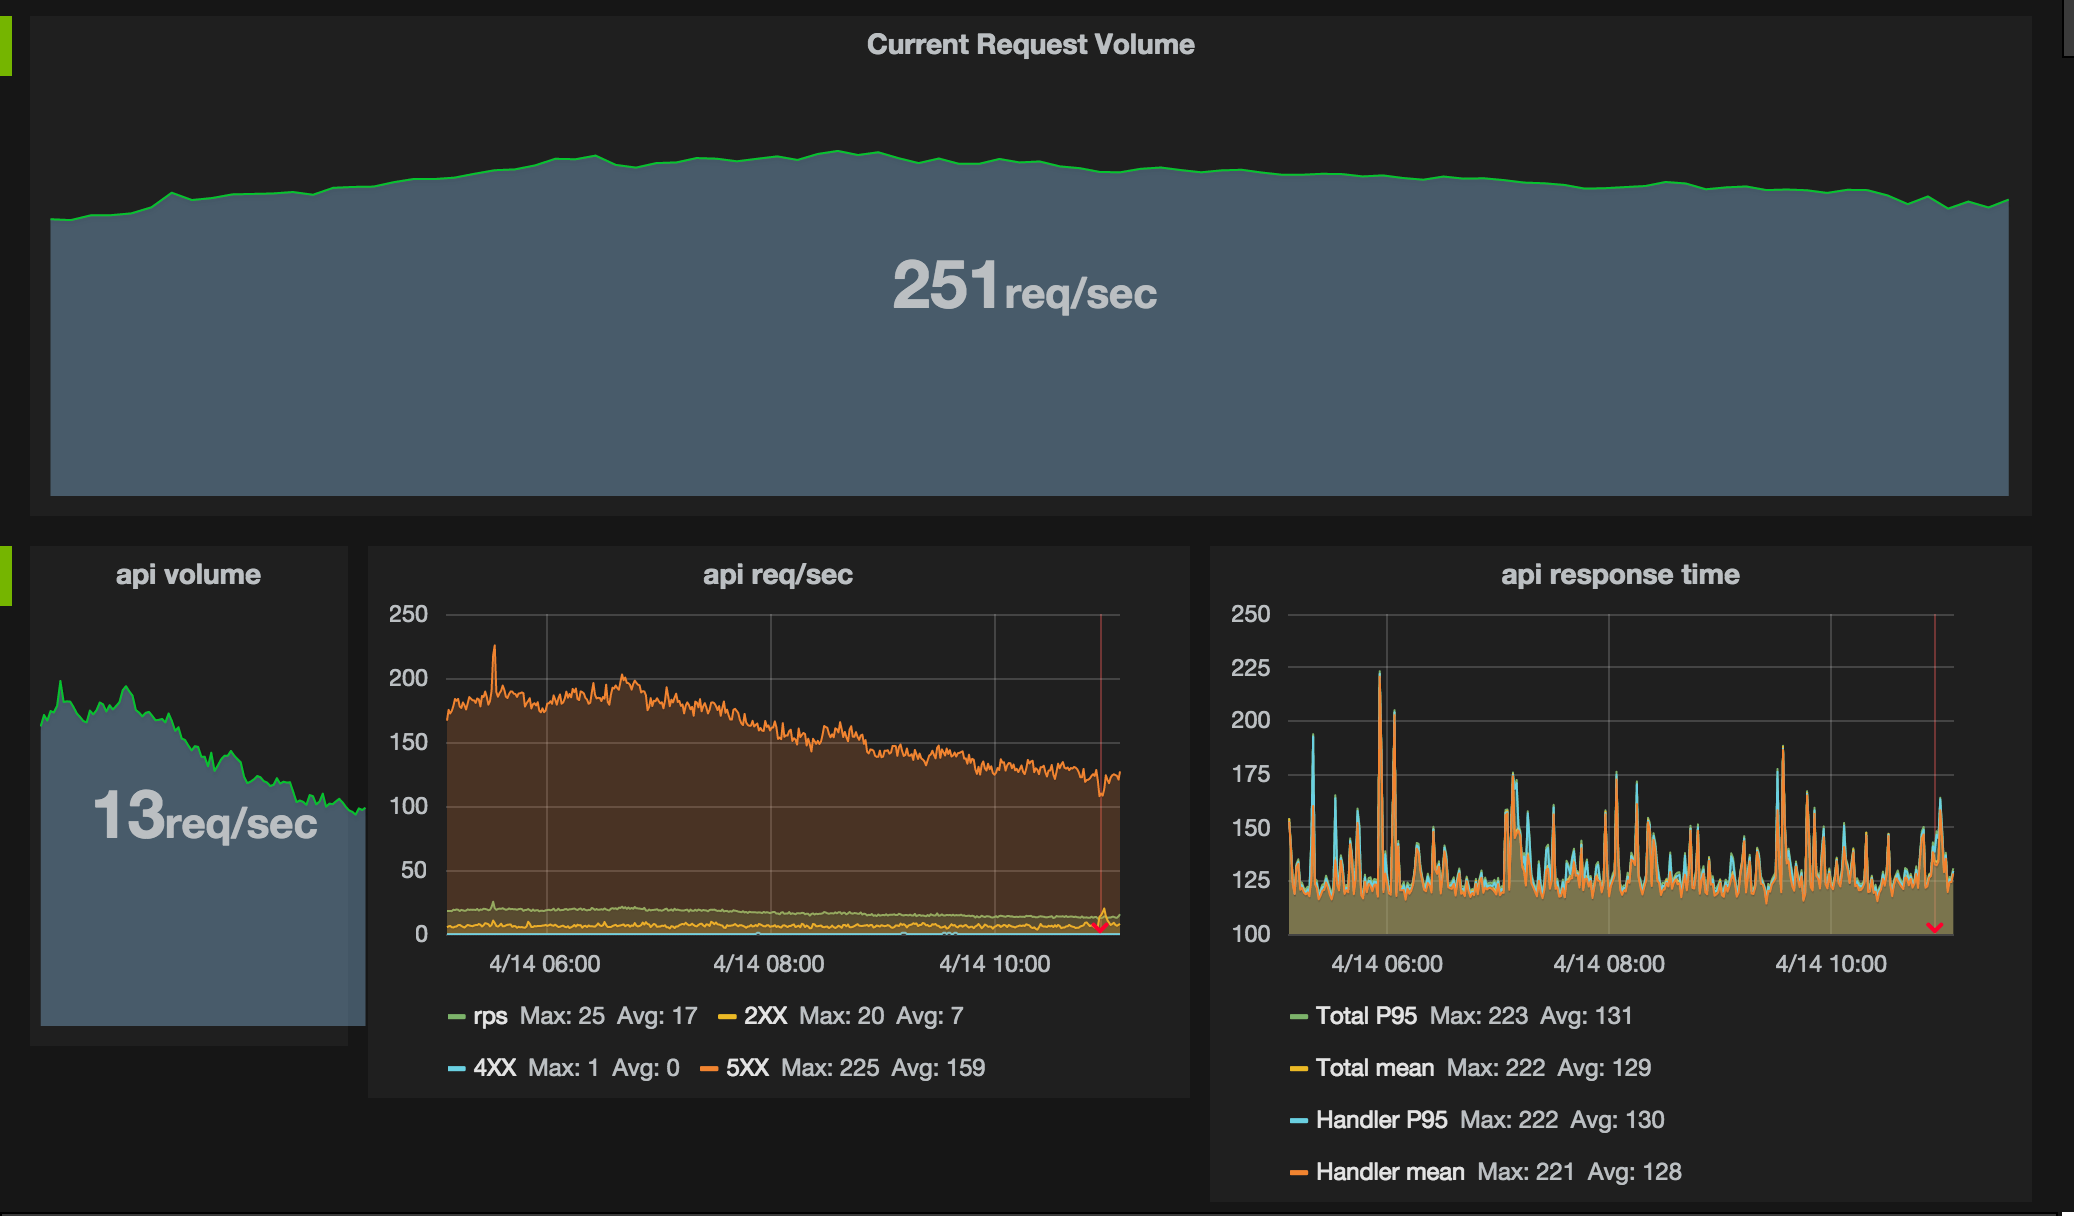
If you would like to create a full width single stat (as in the image) the code is below. Notice how we create a new row on the fly.
const requestVolume = new Panels.SingleStat({
	title: 'Current Request Volume',
	postfix: 'req/sec',
	targets: [
		new Target('stats.$dc.counts').
				sum().scale(0.1)
	],
	row: new Row(),
	dashboard: dashboard
});
Step 5: Create an alert and add it to the graph
Alerts are optional. An alert is set on a target, each target added to the panel receives a refId of 'A', 'B', ..., 'Z'.
const conditionOnRequestLowVolume = new Condition()
        .onQuery('A')
        .withEvaluator(1, 'lt')
        .withReducer('max');

const alert = new Alert({ name: 'Low volume of requests' });
alert.addCondition(conditionOnRequestLowVolume);

// OR

const alert = new Alert({ name: 'Low volume of requests' })
        .addCondition(conditionOnRequestLowVolume);

requestVolume.addAlert(alert);
It is also possible to add an alert by passing it to the Graph constructor
const graphWithAnAlert = new Graph({ alert: YOUR_ALERT_OBJECT });Step 6: Publish the graph
grafana.publish(dashboard);to generate the json and not publish use
console.log(JSON.stringify(dashboard.generate()));A complete example of a dashboard is provided in example.js
Installation
npm install grafana-dash-gen
Tests
npm test
Contributors
- Evan Culver
- Madan Thangavelu
