gl-scatter-plot
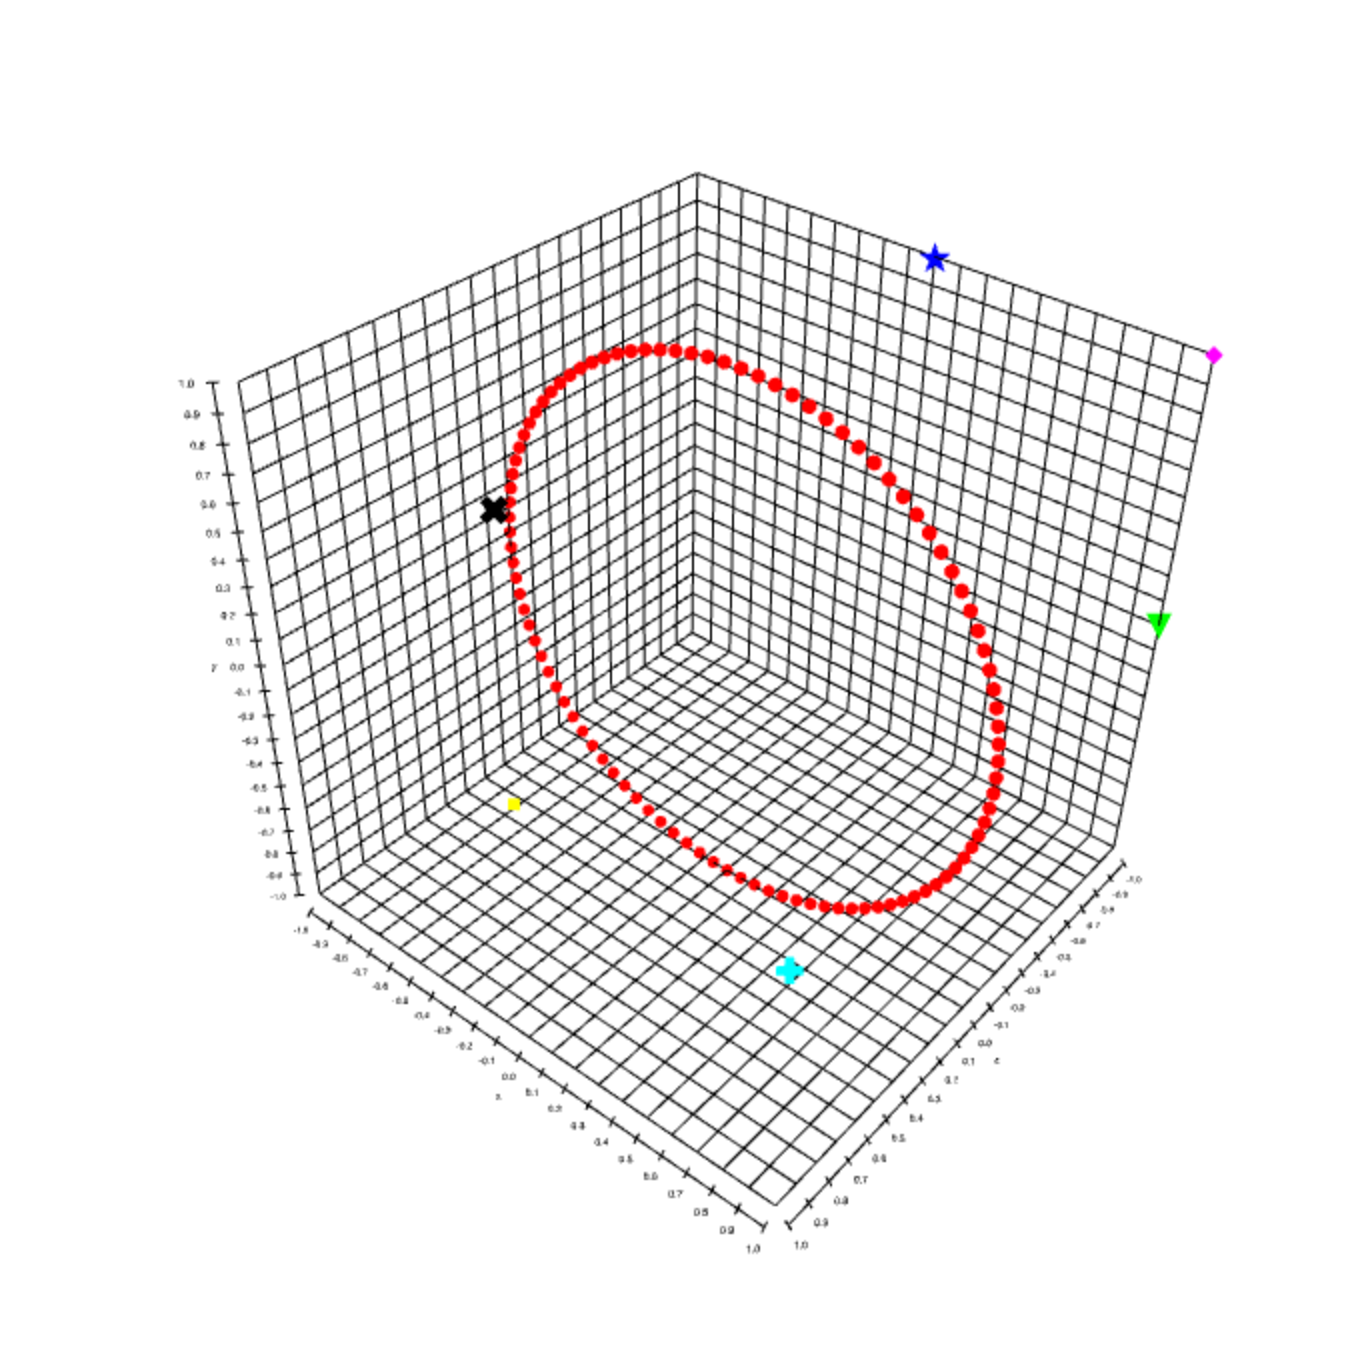
3D WebGL scatter plots with custom point glyphs.
Example
var shell = tickRate: 2var camera = shellvar createPoints = var createAxes = var createSelect = var mat4 = mat4 var points axes select camera shell { //Update size of select buffer selectshape = shellheight shellwidth //Begin pass, look for points within 30 pixels of mouse select //Draw point cloud pick buffer points //End pass, retrieve selection information var selected = select //Look up point id in scatter plot, mark as highlighted var target = points iftarget >= 0 points else points } shellInstall
npm install gl-scatter-plot
API
var createScatterPlot = Constructor
var points = createScatterPlot(gl, options)
Constructs a scatter plot with the given parameters.
glis a WebGL contextoptionsis a JSON object containing configuration data for the scatter plot. For more information, see the documentation in the.updatemethod
Returns A new scatter plot object
Method
Basic rendering
points.update(options)
Updates the scatter plot object. The parameter options is an object with the following properties:
position(Required) an array of length 3 arrays encoding the position of the points in the scatter plot.colorA length 3 array encoding the color of the points in the scatter plot. To set colors per point, pass an array instead. Default is[0,0,0]glyphThe glyph of each point. This is a UTF8 string representing some shape. Per point glyphs can be specified by passing an array. The default glyph is a circle,"●". For more glyph ideas, check out the unicode character set. Some other fun suggestions:"☢", "☯", "❤", "▲", "⚑".sizeThe size of each point, or specified per-point using an array. In orthographic, this is in screen coordinates, or in perspective this is in world coordinates. Default is0.1orthographicA flag, which if set totruecauses the points to be drawn without perspective scaling.pickIdAn 8 bit value which determines the tag for all elements within the pick bufferlineWidththe width of the outline (set to 0 for no outline) Default is0lineColorthe color of the outline for each markerfontthe font used for drawing the glyphs (defaultnormal)anglean angle to rotate the glyphs by in radians (default0)alignmenta 2d vector to offset text drawing by (default[0,0])projecta flag (or array of flags) which determines which axes to project ontoaxisBoundsa pair of 3d arrays representing the bounds of the axes to project ontoprojectOpacitythe opacity of the projected point sprites (default1.0)projectScalethe scaling factor of the projected point sprites (default2.0/3.0)
points.draw(camera)
Draws the scatter plot with the given camera parameters.
-
camerais a JSON object storing the camera parameters for the point cloud. It has the following properties:modelthe model matrix, encoded as a length 16 arrayviewthe view matrix of the camera, encoded as a length 16 arrayprojectionthe projection matrix of the camera, encoded as a length 16 array
points.dispose()
Destroys the scatter plot object and releases all stored resources.
Picking
points.drawPick(camera)
Draws the scatter plot into a pick buffer for point selection purposes.
camerais a camera object, with the same properties as indraw
points.pick(selected)
Finds the index of a point selected by some mouse coordinate.
selectedis the selection information returned by calling end on agl-selectobject
Returns An object representing the highlighted point, or null if no point is selected. The object has the following properties:
indexwhich is the index of the selected pointpositionwhich the 3D position of the selected point in data coordinates
points.highlight(pointId, highlightColor)
Highlights the point with index pointId in the scatter plot by changing its color to highlightColor
pointIdis the index of a point in the scatter plothighlightColoris the color to draw the highlighted point with
If this function is called with no arguments, then it will deselect the currently highlighted point.
Properties
points.bounds
Lower and upper bounds on the point cloud
points.clipBounds
A pair of arrays that determine lower and upper bounds on the scatter plot to draw. These are useful for clipping the scatter plot to a smaller region.
Credits
(c) 2014 Mikola Lysenko. MIT License. Supported by plot.ly