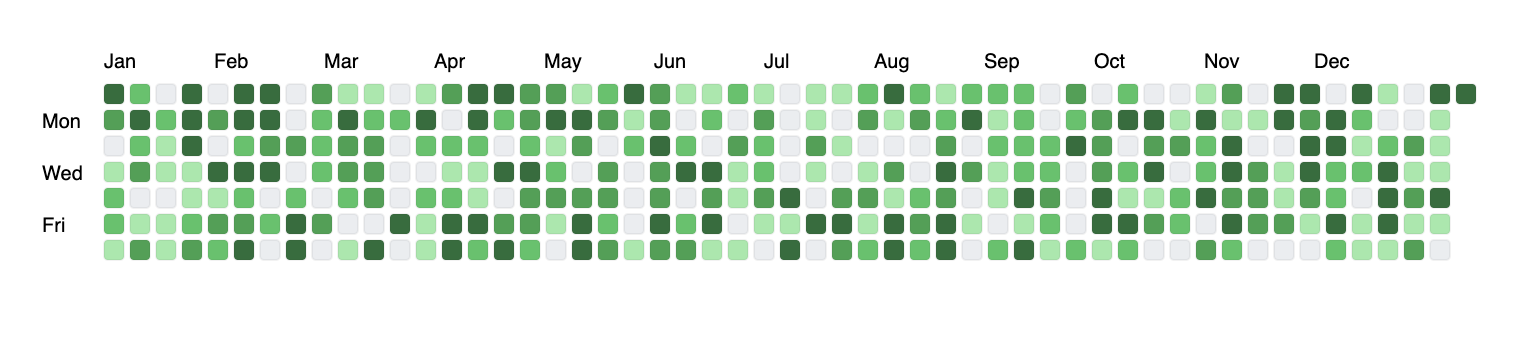
Github Contribution Graph
display your data visually with a github like contribution graph.
install
npm i github-contribution-graphor
yarn add github-contribution-graphusage
import drawContributionGraph from "github-contribution-graph";

// for toottip css
// <link rel="stylesheet" href="https://unpkg.com/github-contribution-graph/src/style.css" crossorigin="anonymous">
// or
// import "github-contribution-graph/src/style.css";

drawContributionGraph({
  data,
  ssr: false,
  config: {
    graphMountElement: "#app",
  },
});
demo
api
drawContributionGraph(data, ssr, config)
data
Type: Object
data to feed the graph, below is an example of the accepted format of the object
const data = {
  2023: [
    {
      done: 12,
      not_done: 4, // it's fine if you keep not_done as 0
      date: "2023-06-07",
    },
    {
      done: 3,
      not_done: 6,
      date: "2023-02-25",
    },
  ],
  2022: [
    {
      done: 7,
      not_done: 3,
      date: "2022-08-01",
    },
  ],
};
ssr
Type: boolean (defaults to false)
set to true if you want to use this package in server side rendering
config
Type: object children types : string or number
graphWidth
(defaults to 723)
width of the contribution graph
graphHeight
(defaults to 113)
height of the contribution graph
graphMountElement
(defaults to body)
the css selector of the element to which the contribution graph to be appended
graphTheme
(defaults to standard)
theme of the graph (check in utils/themes.js for available themes)