feathers-profiler


Log service method calls and gather profile information on them.
Installation
npm install feathers-profiler --save
Example
npm start
Documentation
Service calls transported by websockets are not passed through Express middleware.
feathers-profiler logs service calls from all transports
and gathers performance information on them.
import { profiler, getProfile, clearProfile, getPending, timestamp } from 'feathers-profiler';
app.configure(profiler(options))
Start logging and/or profiling service calls.
Options:
- logger
- defaults to logging on
console.log. nulldisables logging.require('winston')routes logs to the popular winston logger.{ log: payload => {} }routes logs to your customized logger.
- defaults to logging on
- logMsg
- default message is shown below.
hook => {}returns a custom string or object payload for the logger.hook._logcontains log information;hook.originalandhook.errorcontain error information.
- stats
nullor'none'profile information will not be gathered.totalgathers profile information by service and method only. The default.detailgathers profile information by characteristics of the call.
- statsDetail
- default is shown below.
hook => {}returns a custom category for the call.
getProfile()
Returns profile information as an object.
clearProfile()
Re-initializes the profile information.
The profile internal counts may not add up perfectly unless getPending() === 0.
getPending()
Returns the number of currently pending service calls.
timestamp()
Returns a timestamp suitable for logging to the console.
Example
const feathers = ;const rest = ;const sockets = ;const hooks = ;const bodyParser = ;const errorHandler = ; const profiler getProfile getPending = ; // Initialize the applicationconst app = // Needed for parsing bodies (login) // services Usage
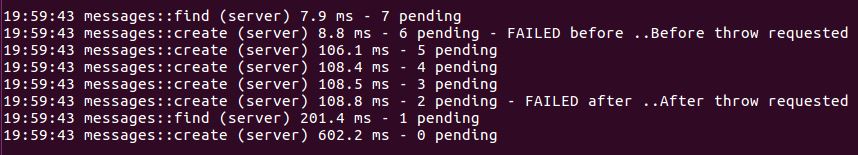
Logs service calls
The log message may be customized. The default log message includes:
- Service name, method and transport provider.
- Elapsed time between the method being called and its completion.
- Number of service calls pending when call was made.
- Where service call failed and why.
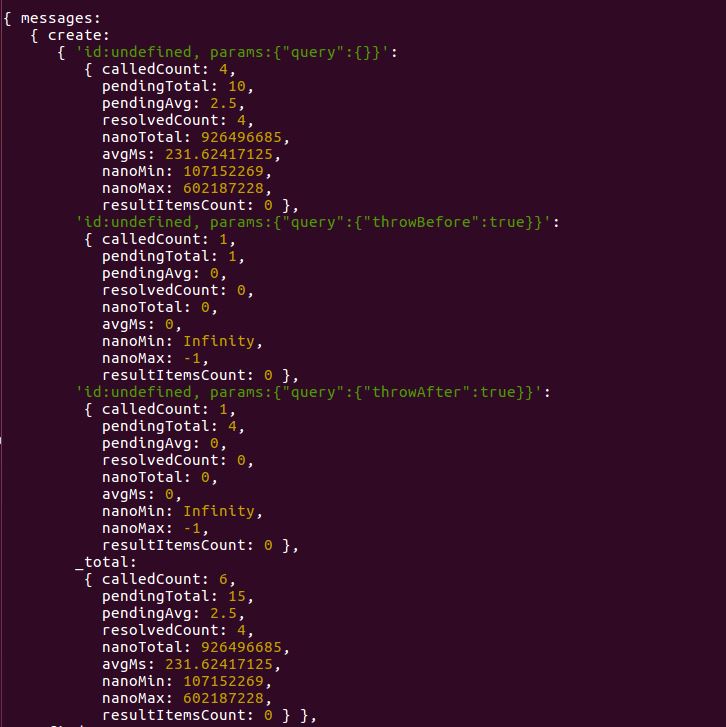
Gathers profile information on service calls
Profile information is:
- Grouped by service and method.
- Grouped by characteristics of the call. These may be customized.
- Average pending count provides information on how busy the server was during these calls.
- Average, min and max elapsed time provide information on how responsive the server is.
- The number of returned items provides information on how large the
findresults were.
License
Copyright (c) 2016
Licensed under the MIT license.