Express-influx-multilogger
An Express middleware for better monitoring of your Node.js apps. Parse important req, res and header objects to Influx and Grafana. Get an easier insight of your API without any costs.
Note: this is in active development, and could contain bugs. Please make an issue if you find some.
Getting started
Installation
-
Install package
- Npm
npm install express-influx-multilogger- Yarn
yarn add express-influx-multilogger -
Require
const multilogger = require('express-influx-multilogger'); -
(Required if you want to write to influx) Initialize database in your app.js
multilogger.init({ database: { server: "127.0.0.1", name: "myMultilogDb", port: 8086 }, interval: 10000, performance: true, }); -
Add multilogger log function right before your router of choice
app.use(multilogger.log({ development: false, extended: false })); -
Add multierror function before catching 404 and after your router
app.use(multilogger.error()); -
In case of using geolocation, make sure your server can make use of req.connection.remoteAddress
-
You can also add extra custom metrics for monitoring other things, like your database calls
Add this line in your code (make sure you require multilogger). Name and timing parameters are required. Custom is optional.
 multilogger.insertDatabaseCallSpeed({
   name: "Random name", // name of your metric (like a database call)
   timing: 0.2443, //in ms
   custom: {
     customOption1: "foo",
     foo: foo.bar,
   }
 });
Example
const express = require("express");
const bodyParser = require("body-parser");
const cookieParser = require("cookie-parser");
const multilogger = require('express-influx-multilogger'); // Add this to imports

const indexRouter = require("./routes/index");

//  Add this to write data to influx (not required)
multilogger.init({
    database: {
        server: "127.0.0.1",
        name: "myMultilogDb",
        port: 8086
         },
    interval: 10000,  // Write to Influx every 10 seconds,
    performance: true // Write host performance to Influx (mem, cpu,..)
});
multilogger.startPerformanceMetrics();

const app = express();

app.use(bodyParser.urlencoded({ extended: true }));
app.use(bodyParser.json());
app.use(cookieParser());

// Add this before your router of choice
app.use(multilogger.log({ development: false, extended: false }));
app.use("/", indexRouter); // Your router

// Add this before 404 if you want to capture your errors as well
app.use(multilogger.error());

module.exports = app;
Loggable headers
The data being sent to Influx consists of ...
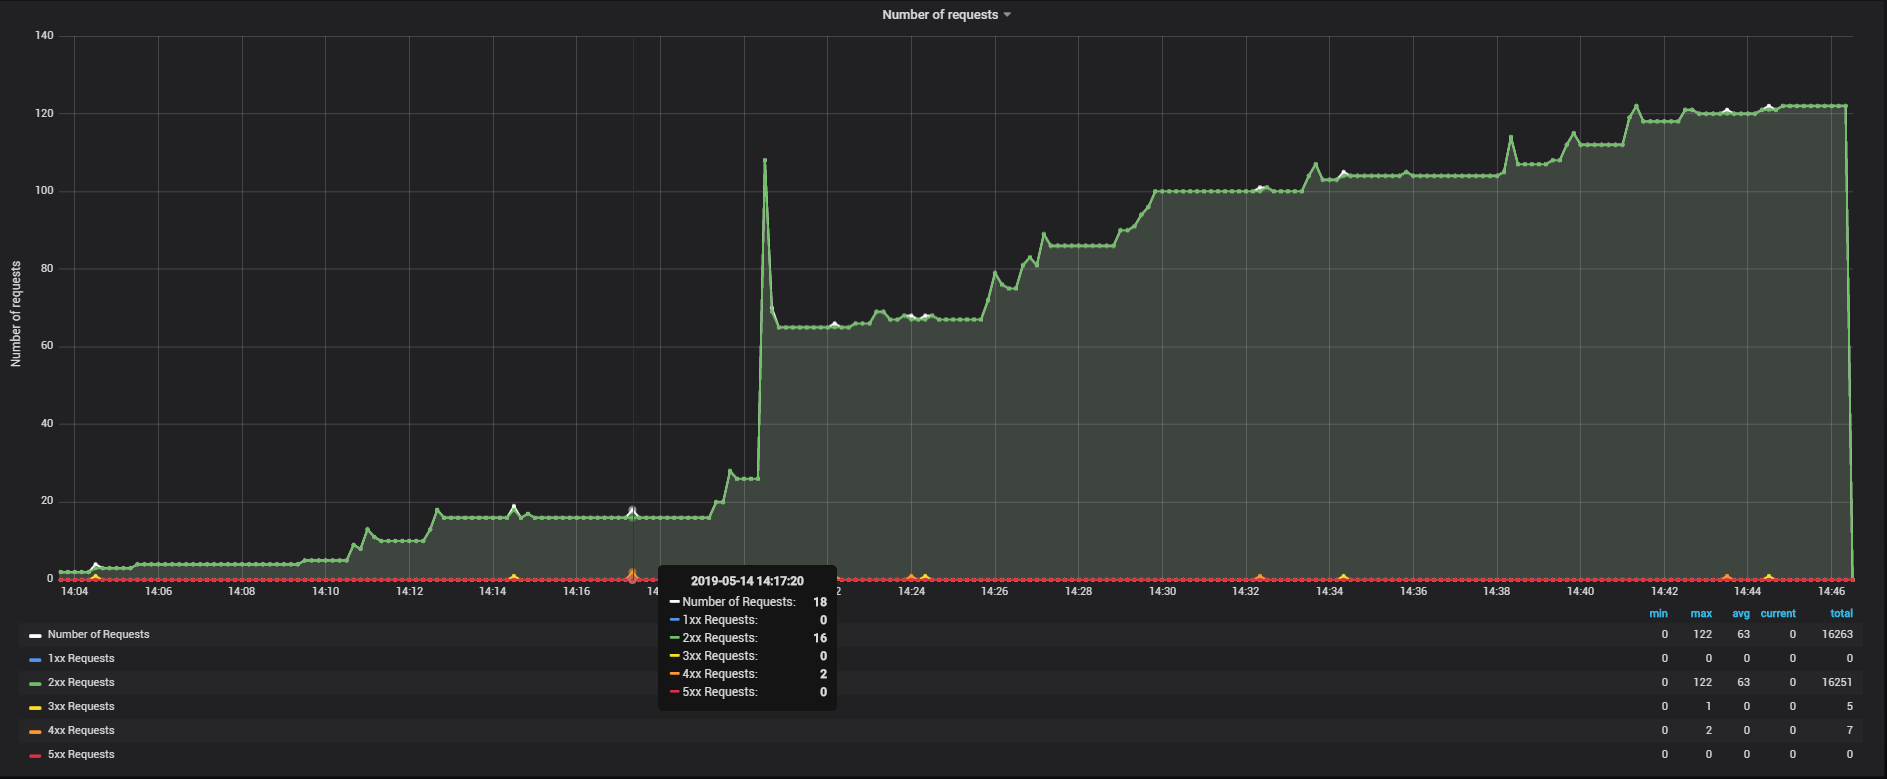
Fields
...logs of the amount of calls per statuscode per given interval
    amountOf1xx: Influx.FieldType.INTEGER,
    amountOf2xx: Influx.FieldType.INTEGER,
    amountOf3xx: Influx.FieldType.INTEGER,
    amountOf4xx: Influx.FieldType.INTEGER,
    amountOf5xx: Influx.FieldType.INTEGER
...logs of Response Time, CPU and memory Usage of the OS, host and ip;
    responseTime: Influx.FieldType.FLOAT,
    cpuUsage: Influx.FieldType.FLOAT,
    memoryUsage: Influx.FieldType.FLOAT,
    requests: Influx.FieldType.INTEGER,
    host: Influx.FieldType.STRING,
    ip: Influx.FieldType.STRING
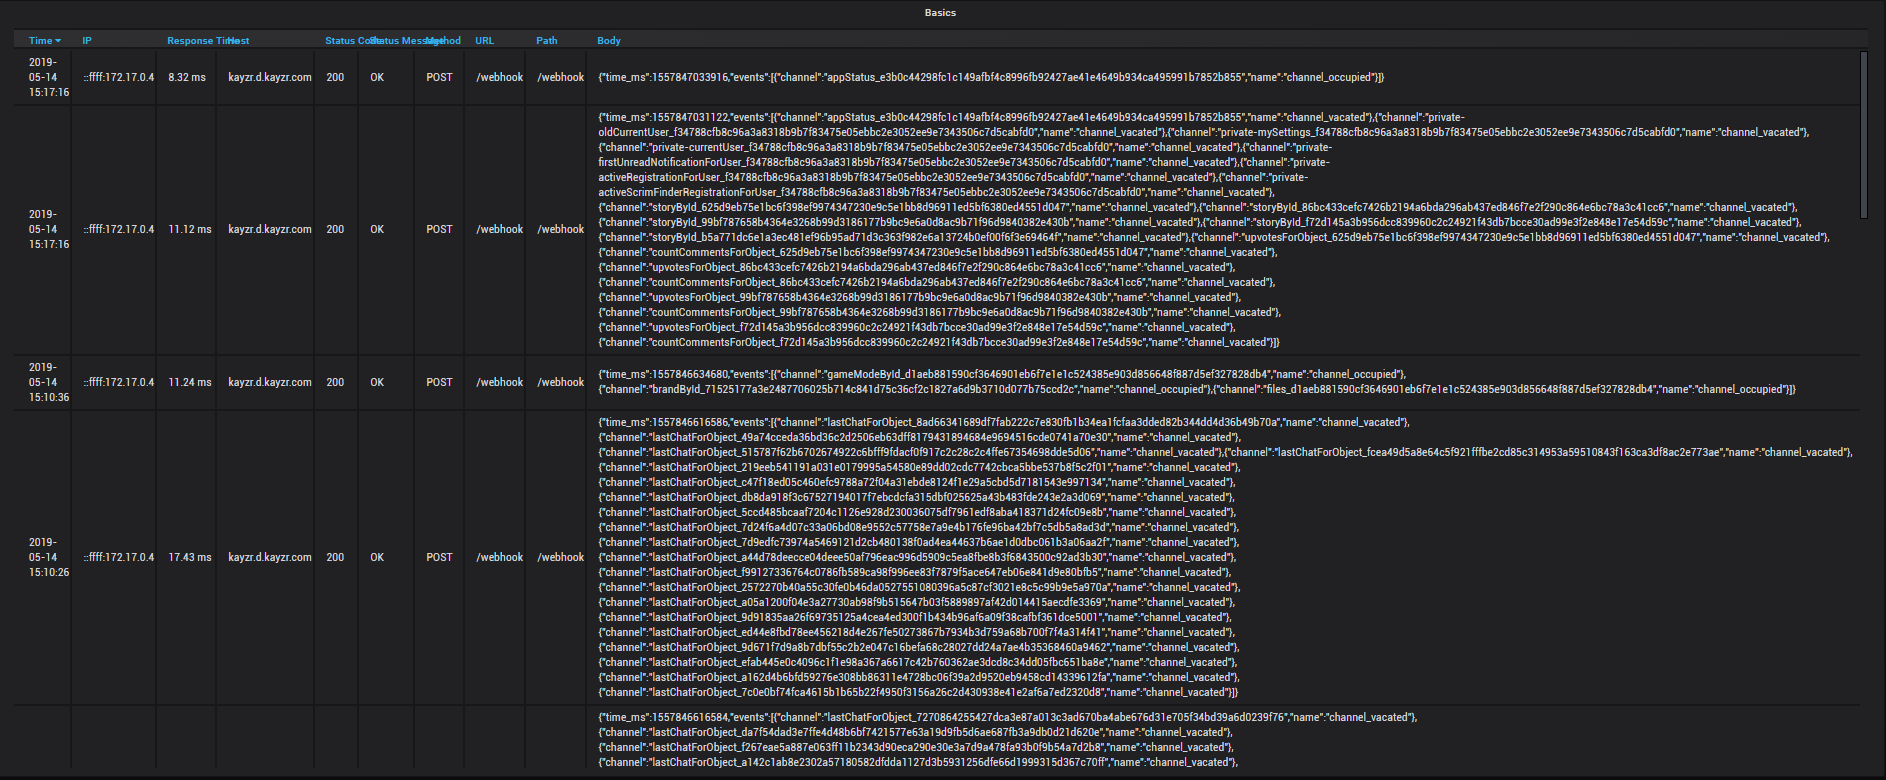
Tags
...logs of basic headers to Influx
    "statusCode",
    "statusMessage",
    "method",
    "path",
    "url",
    "ip",
    "country",
    "geohash", // Used to get the geolocation of your api call from a given IP
    "client",
    "body",
    "query",
    "params",
    "auth", // In case you wanna know wich user that triggered the api call
    "errorMessage", // In case of an error: sends message and stack
    "errorStack"
Parameters
- Extended: Logs a pretty view of req, res and headers (defaults false)
- Development: Logs the object that Influx will recieve
- Database:
- server: The address of your Influx database. (defaults: 127.0.0.1)
- name: Name of your Influx database. (defaults: myMultilogDb)
- port: Port of your Influx database. (defaults: 3000)
- username: Login credentials of your Influx database. (defaults: '')
- password: Password of your Influx database. (defaults: '')
- Interval: Defines the rate in ms of the interval you want to write your data to your Influx database
Reset Table
What if you have sent wrong info to Influx? You can make use of the Influx-cli to drop your database or a certain metric or series (table)
> DROP DATABASE <db_name>
> DROP MEASUREMENT <measurement_name>
> DROP SERIES FROM <db_series>
For more info, you can check the docs.
Grafana

If you want to use Grafana and don't want to write your dashboard, you can import the dashboard JSON. You can certainly write your own dashboard, as I'm not that skilled with Grafana.
By using this dashboard, make sure you install the worldmap plugin.
License
Distributed under the MIT License. See LICENSE for more information.