
ecStat
A statistical and data mining tool for Apache ECharts (incubating). You can use it to analyze data and then visualize the results with ECharts, or just use it to process data.
It works both in node.js and in the browser.
Read this in other languages: English, 简体中文.
Installing
If you use npm, you can install it with:
npm install echarts-statOtherwise, download this tool from dist directory:
API Reference
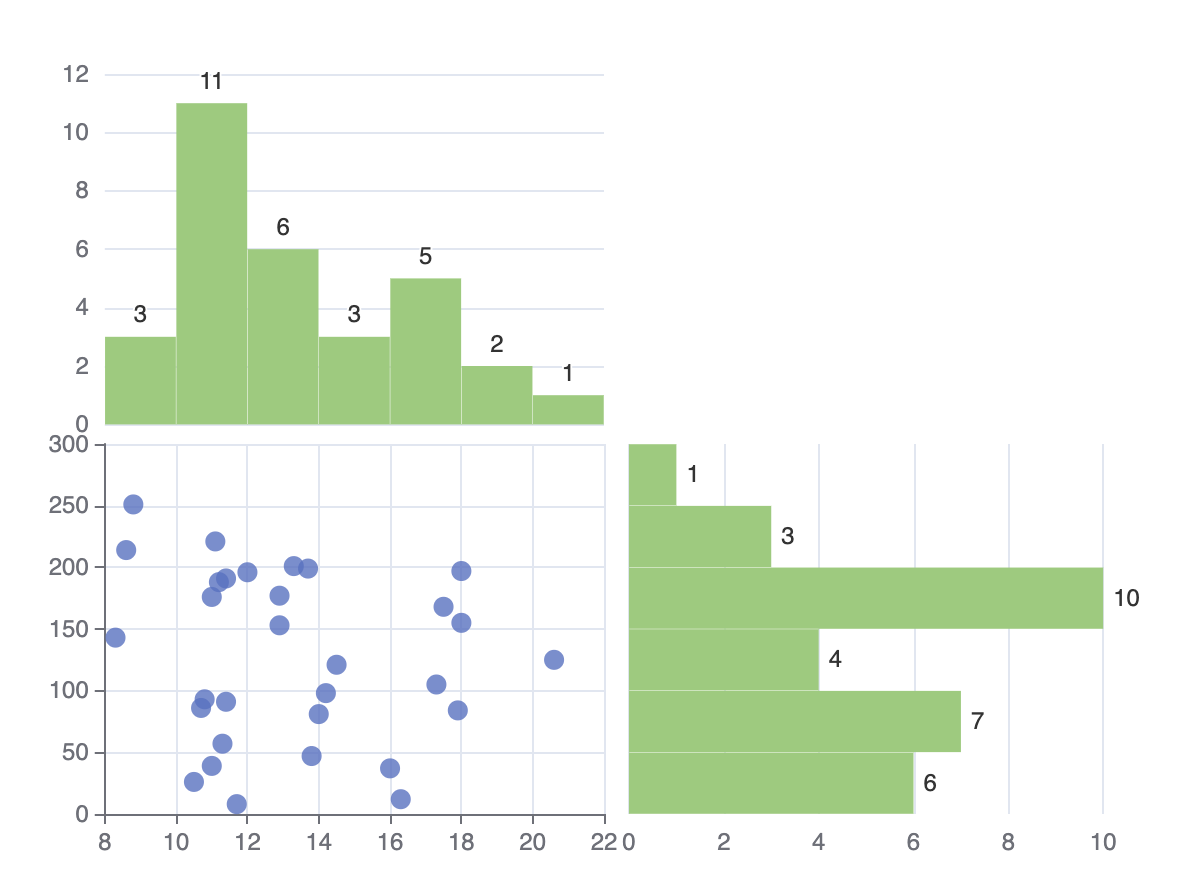
Histogram
A histogram is a graphical representation of the distribution of numerical data. It is an estimate of the probability distribution of a quantitative variable. It is a kind of bar graph. To construct a histogram, the first step is to "bin" the range of values - that is, divide the entire range of values into a series of intervals - and then count how many original sample values fall into each interval. The bins are usually specified as consecutive, non-overlapping intervals of a variable. Here the bins(intervals) must be adjacent, and are of equal size.
Syntax
- Used as echarts transform (since echarts 5.0)echarts;chart;
- Standalonevar bins = ecStat;// orvar bins = ecStat;
Parameter
-
data-number[] | number[][]. Data samples of numbers.// One-dimension arrayvar data = 86 88 105 107 108 110 ... ;or
// Two-dimension arrayvar data = 83 143 86 214 ...; -
config-object.-
config.method-'squareRoot' | 'scott' | 'freedmanDiaconis' | 'sturges'. Optional. Methods to calculate the number of bin. There is no "best" number of bin, and different bin size can reveal different feature of data.-
squareRoot- This is the default method, which is also used by Excel histogram. Returns the number of bin according to Square-root choice:var bins = ecStat; -
scott- Returns the number of bin according to Scott's normal reference Rule:var bins = ecStat; -
freedmanDiaconis- Returns the number of bin according to The Freedman-Diaconis rule:var bins = ecStat; -
sturges- Returns the number of bin according to Sturges' formula:var bins = ecStat;
-
-
config.dimensions-(number | string). Optional. Specify the dimensions of data that are used to regression calculation. By default0, which means the column 0 and 1 is used in the regression calculation. In echarts transform usage, both dimension name (string) and dimension index (number) can be specified. In standalone usage, only dimension index can be specified (not able to define dimension name).
-
Return Value (only for standalone usage)
- Used as echarts transform (since echarts 5.0)dataset:source: ...transform: 'ecStat:histogram'// // The result data of this dataset is like:// [// // MeanOfV0V1, VCount, V0, V1, DisplayableName// [ 10, 212 8, 12, '8 - 12'],// ...// ]// // The rest of the input dimensions that other than// // config.dimensions specified are kept in the output.
- Standalone
result-object. Contain detailed messages of each bin and data used for ECharts to draw the histogram.result.bins-BinItem[]. An array of bins, where each bin is an object (BinItem), containing three attributes:x0-number. The lower bound of the bin (inclusive).x1-number. The upper bound of the bin (exclusive).sample-number[]. Containing the associated elements from the input data.
result.data-[MeanOfV0V1, VCount, V0, V1, DisplayableName][]. Used for bar chart to draw the histogram, where the length ofsampleis the number of sample values in this bin. For example:var binsdata =// MeanOfV0V1, VCount, V0, V1, DisplayableName10 212 8 12 '8 - 12'...;// The rest of the input dimensions that other than// config.dimensions specified are kept in the output.result.customData-[V0, V1, VCount][]. Used for custom chart to draw the histogram, where the length ofsampleis the number of sample values in this bin.
Examples
test/transform/histogram_bar.html
test/standalone/histogram_bar.html
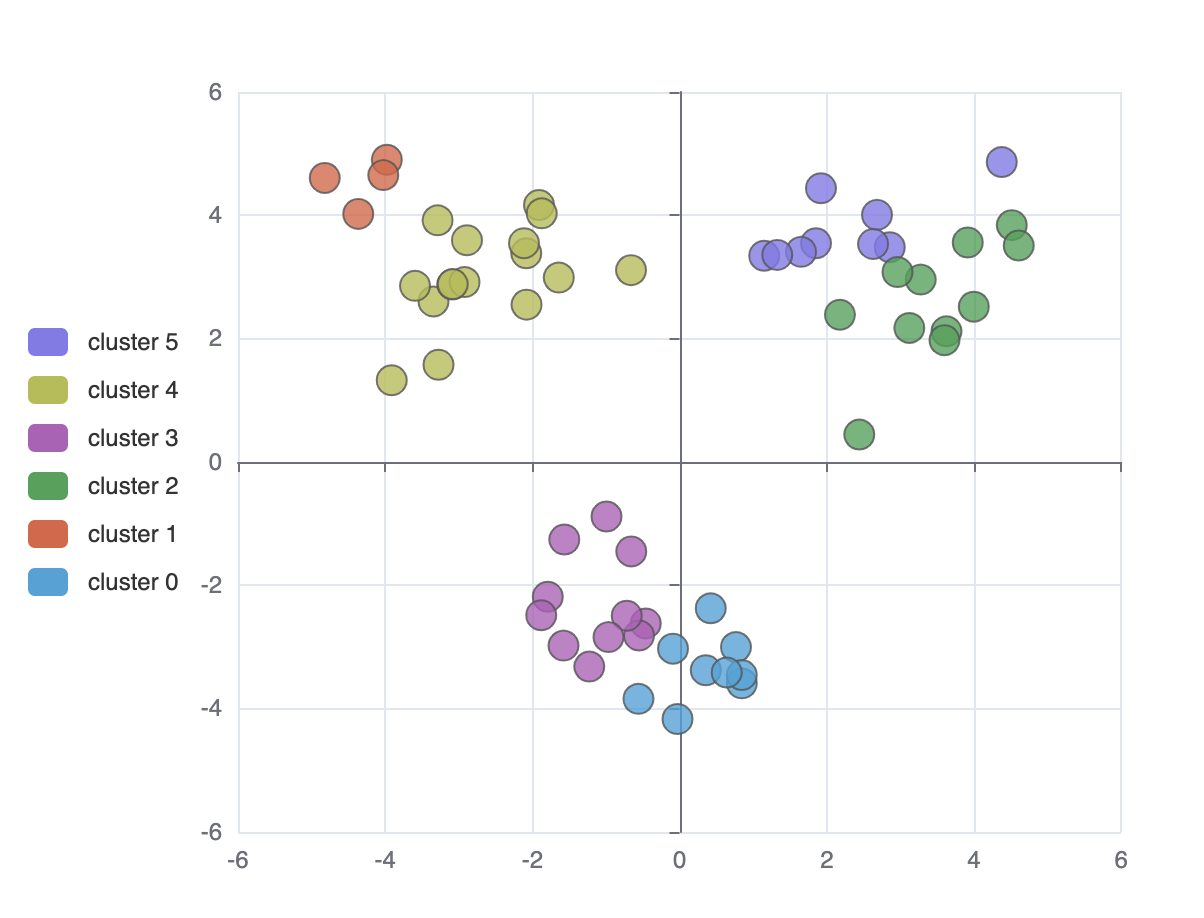
Clustering
Clustering can divide the original data set into multiple data clusters with different characteristics. And through ECharts, you can visualize the results of clustering, or visualize the process of clustering.
Syntax
- Used as echarts transform (since echarts 5.0)echarts;chart;
- Standalonevar result = ecStatclustering;// orvar result = ecStatclustering;
Parameter
-
data-number[][]. Two-dimensional numeric array, each data point can have more than two numeric attributes in the original data set. In the following example,data[0]is calleddata pointanddata[0][1]is one of the numeric attributes ofdata[0].var data =232 421 51 0323 19321 162 18 0139 10551 1121 13 0641 15...; -
config-object.config.clusterCount-number. Mandatory. The number of clusters generated. Note that it must be greater than 1.config.dimensions-(number | string)[]. Optional. Specify which dimensions (columns) of data will be used to clustering calculation. The other columns will also be kept in the output data. By default all of the columns of the data will be used as dimensions. In echarts transform usage, both dimension name (string) and dimension index (number) can be specified. In standalone usage, only dimension index can be specified (not able to define dimension name).config.stepByStep-boolean. Optional. Control whether doing the clustering step by step. By defaultfalse.config.outputType-'single' | 'multiple'. Optional. Specify the format of the output. In "standalone" usage, it is by default'multiple'. In "transform" usage, it can not be specified, always be'single'.config.outputClusterIndexDimension-(number | {index: number, name?: string}). Mandatory. It only works inconfig.outputType: 'single'. In this mode, the cluster index will be written to that dimension index of the output data. If be anumber, it means dimension index. Dimension index is mandatory, while dimension name is optional, which only enables the downstream refer this dimension by name.config.outputCentroidDimensions-(number | {index: number, name?: string})[]Optional. It only works inconfig.outputType: 'single'. If specify, the cluster centroid will be written to those dimensions of the result data. By default the centroids will not be written to the result data. If be anumber, it means dimension index. Dimension index is mandatory, while dimension name is optional, which only enables the downstream refer this dimension by name.
Return Value
For example, the input data is:
var data = // dimensions: // 0 1 2 3 4 232 421 51 0323 'xxx' 321 162 18 0139 'xzx' 551 1121 13 0641 'yzy' ...;And we specify the config as:
config = dimensions: 2 3 outputClusterIndexDimension: 5The result will be:
- Used as echarts transform (since echarts 5.0)dataset:source: ...transform: 'ecStat:clustering'config:clusterCount: 6outputClusterIndexDimension: 5outputCentroidDimensions: 6 7// The result data of this dataset will be:// [// // dim2, dim3 are used in clustering.// // All of the input data are kept in the output.// // dim5 is the output cluster index.// // dim6 is the output distance value.// // dimensions:// // 0 1 2 3 4 5 6 7// [ 232, 4.21, 51, 0.323, 'xxx', 0, 14, 0.145 ],// [ 321, 1.62, 18, 0.139, 'xzx', 2, 24, 0.321 ],// [ 551, 11.21, 13, 0.641, 'yzy', 0, 14, 0.145 ],// ...// ]fromDatasetIndex: 1fromTransformResult: 1// The result data of this dataset will be:// centroids: [// // center of cluster0// [14, 0.145],// // center of cluster1// [24, 0.321],// ...// ]
- Standalone
outputType: 'single':result-object. For example:result =data:// dim2, dim3 are used in clustering.// All of the input data are kept in the output.// dim5 is the output cluster index.// dim6 is the output distance value.// dimensions:// 0 1 2 3 4 5 6232 421 51 0323 'xxx' 0 89321 162 18 0139 'xzx' 2 23551 1121 13 0641 'yzy' 0 ??...centroids:// center of cluster014 0145// center of cluster124 0321...}
outputType: 'multiple':result-object. Including the centroids, and pointsInCluster. For example:result =pointsInCluster:// points in cluster0232 421 51 0323 'xxx'551 1121 13 0641 'yzy'...// points in cluster1321 162 18 0139 'xzx'......centroids:// center of cluster014 0145// center of cluster124 0321...;
Examples
You can not only do cluster analysis through this interface, but also use ECharts to visualize the results.
Note: the clustering algorithm can handle multiple numeric attributes, but for the convenience of visualization, two numeric attributes are chosen here as an example.
Directly visualize the final results of clustering
test/transform/clustering_bikmeans.html
test/standalone/clustering_bikmeans.html
Visualize the process of clustering
test/standalone/clustering_animation.html

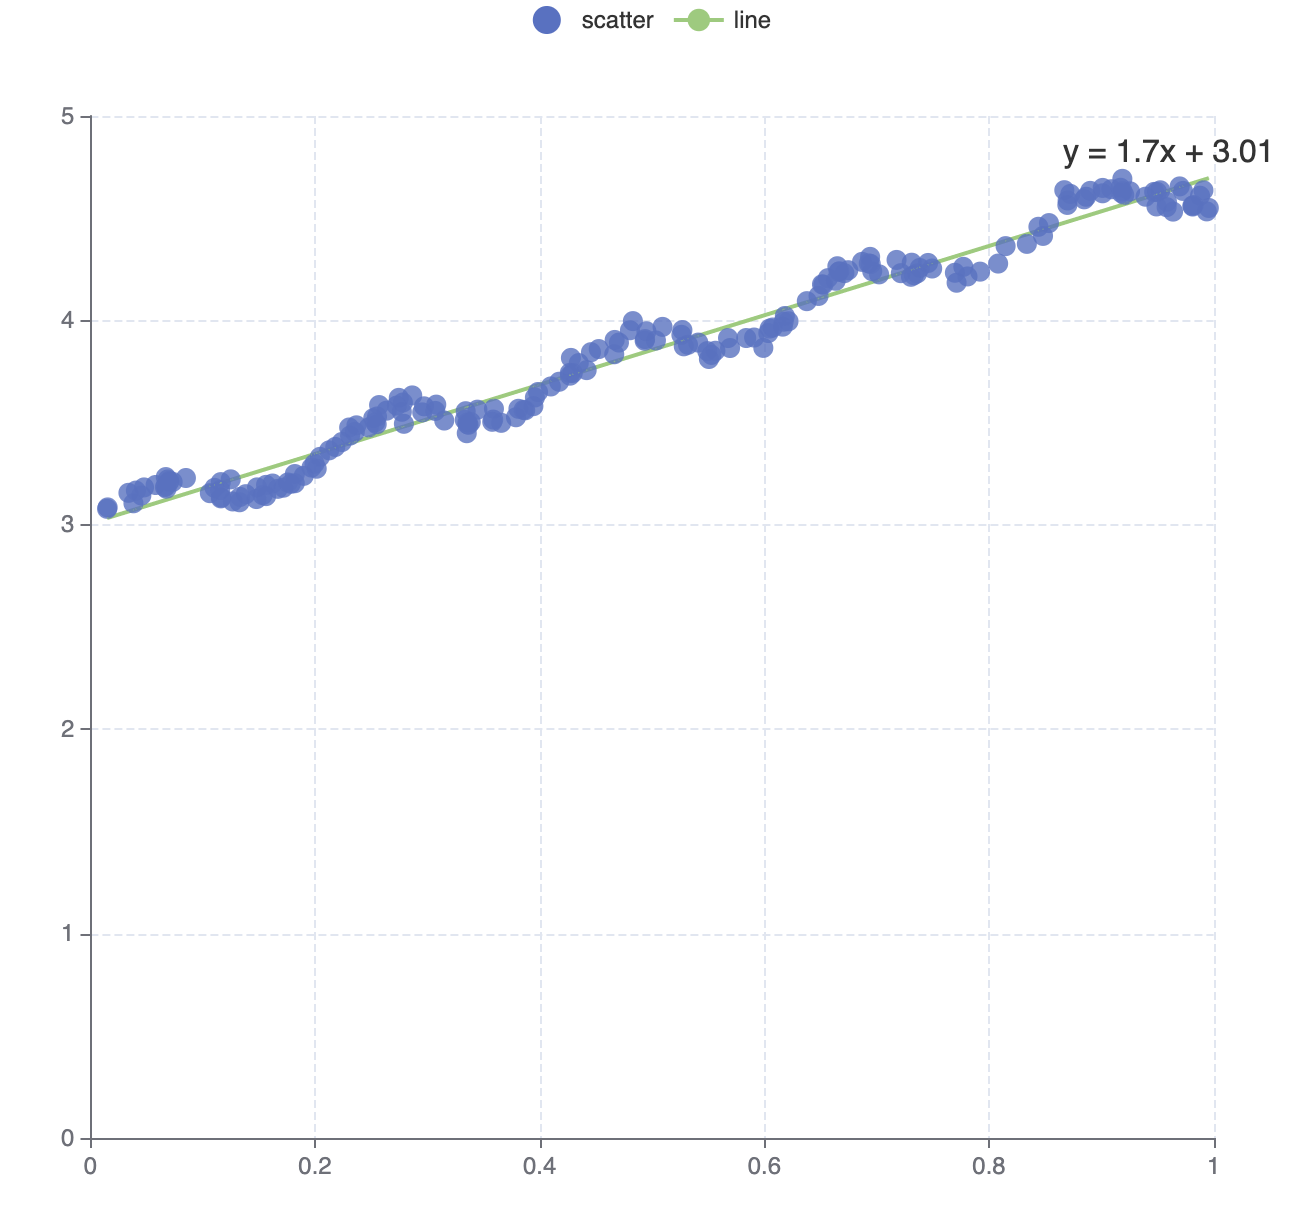
Regression
Regression algorithm can according to the value of the dependent and independent variables of the data set, fitting out a curve to reflect their trends. The regression algorithm here only supports two numeric attributes.
Syntax
- Used as echarts transform (since echarts 5.0)echarts;chart;
- Standalonevar myRegression = ecStat;// orvar myRegression = ecStat;
Parameters
regressionType-string. Mandatory. There are four types of regression, which are'linear','exponential','logarithmic','polynomial'.data-number[][]. Two-dimensional numeric array, Each data object should have two numeric attributes in the original data set. For Example:var data =1 23 5...;opt-object.opt.dimensions-(number | string)[] | (number | string). Optional. Specify the dimensions of data that are used to regression calculation. By default[0, 1], which means the column 0 and 1 is used in the regression calculation. In echarts transform usage, both dimension name (string) and dimension index (number) can be specified. In standalone usage, only dimension index can be specified (not able to define dimension name).opt.order-number. Optional. By default2. The order of polynomial. If you choose other types of regression, you can ignore it.
Return Value (only for standalone usage)
- Used as echarts transform (since echarts 5.0)dataset:source: ...transform: 'ecStat:regression'// // The result of this dataset is like:// [// // ValueOnX, ValueOnY// [ 23, 51 ],// [ 24, 62 ],// ...// ]// // The rest of the input dimensions that other than// // config.dimensions specified are kept in the output.
- Standalone
-
myRegression-object. Including points, parameter, and expression. For Example:myRegressionpoints =// ValueOnX, ValueOnY23 5124 62...;// The rest of the input dimensions that other than// config.dimensions specified are kept in the output.// This is the parameter of linear regression,// for other types, it should be a little differentmyRegressionparameter =gradient: 1695intercept: 3008;myRegressionexpression = 'y = 1.7x + 3.01';
-
Examples
You can not only do regression analysis through this interface, you can also use ECharts to visualize the results.
Linear Regression
test/transform/regression_linear.html
test/standalone/regression_linear.html
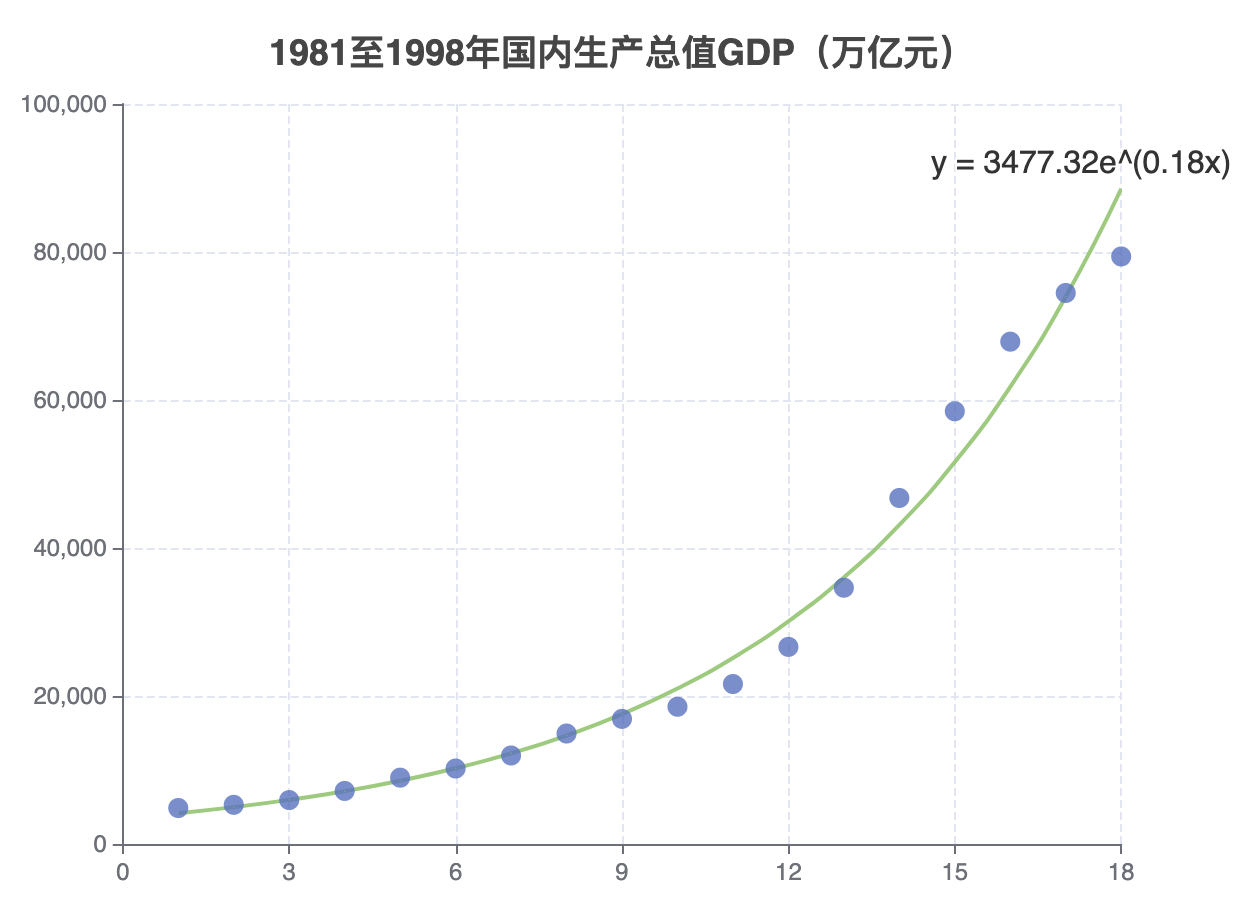
Exponential Regression
test/transform/regression_exponential.html
test/standalone/regression_exponential.html
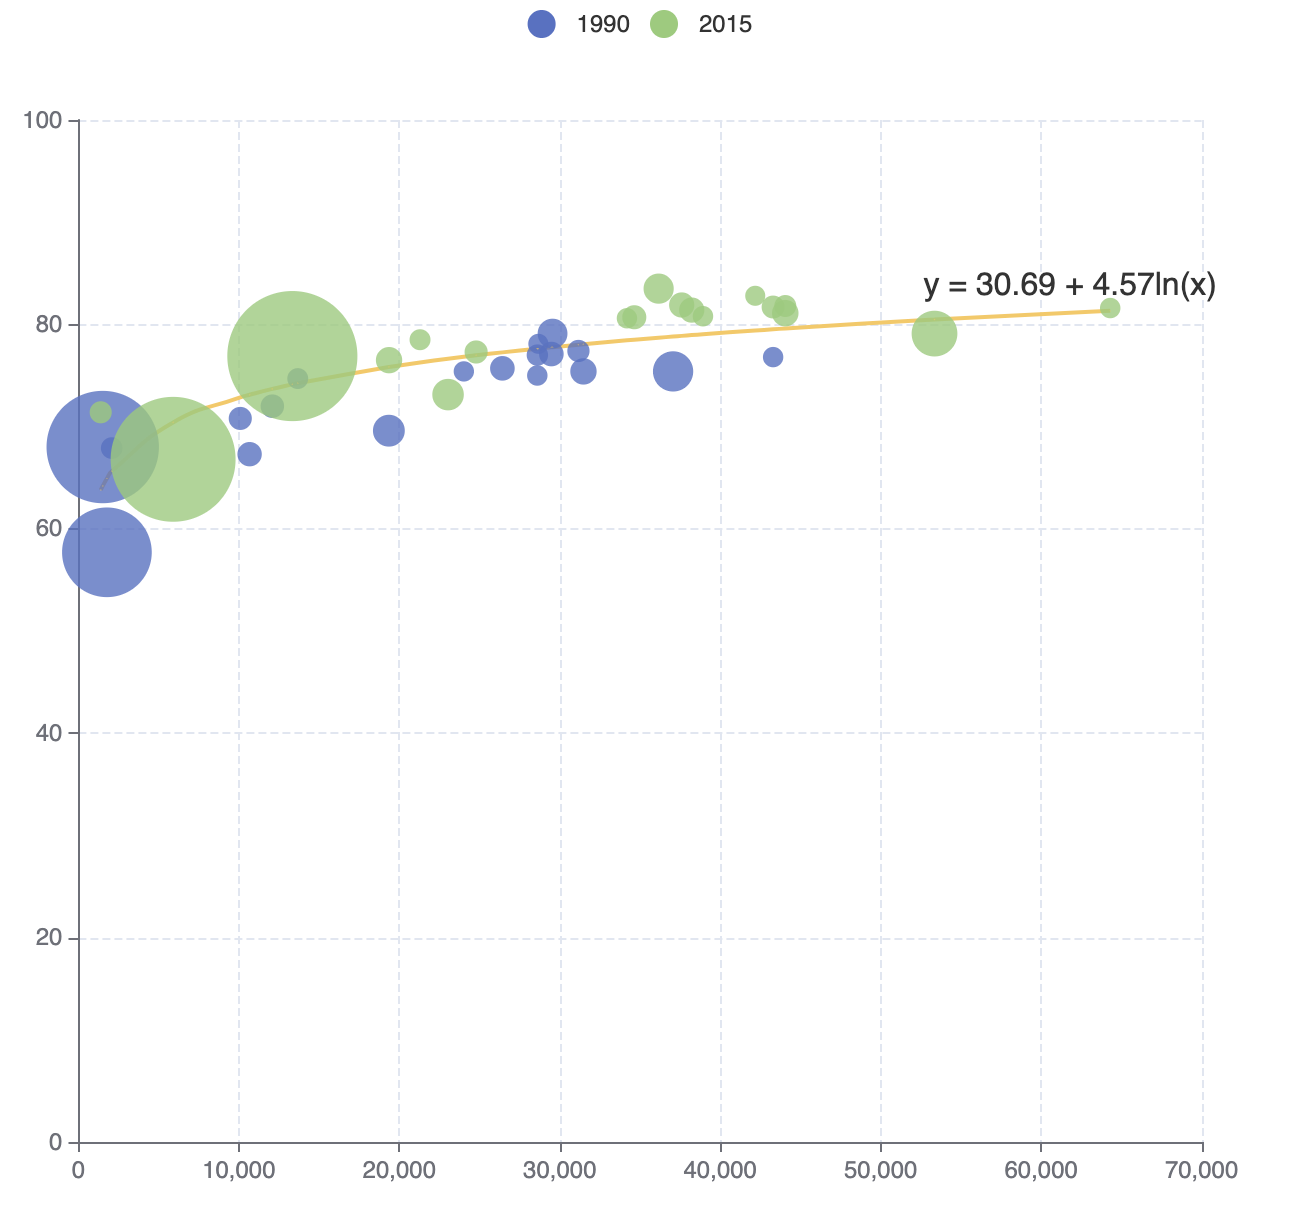
Logarithmic Regression
test/transform/regression_logarithmic.html
test/standalone/regression_logarithmic.html
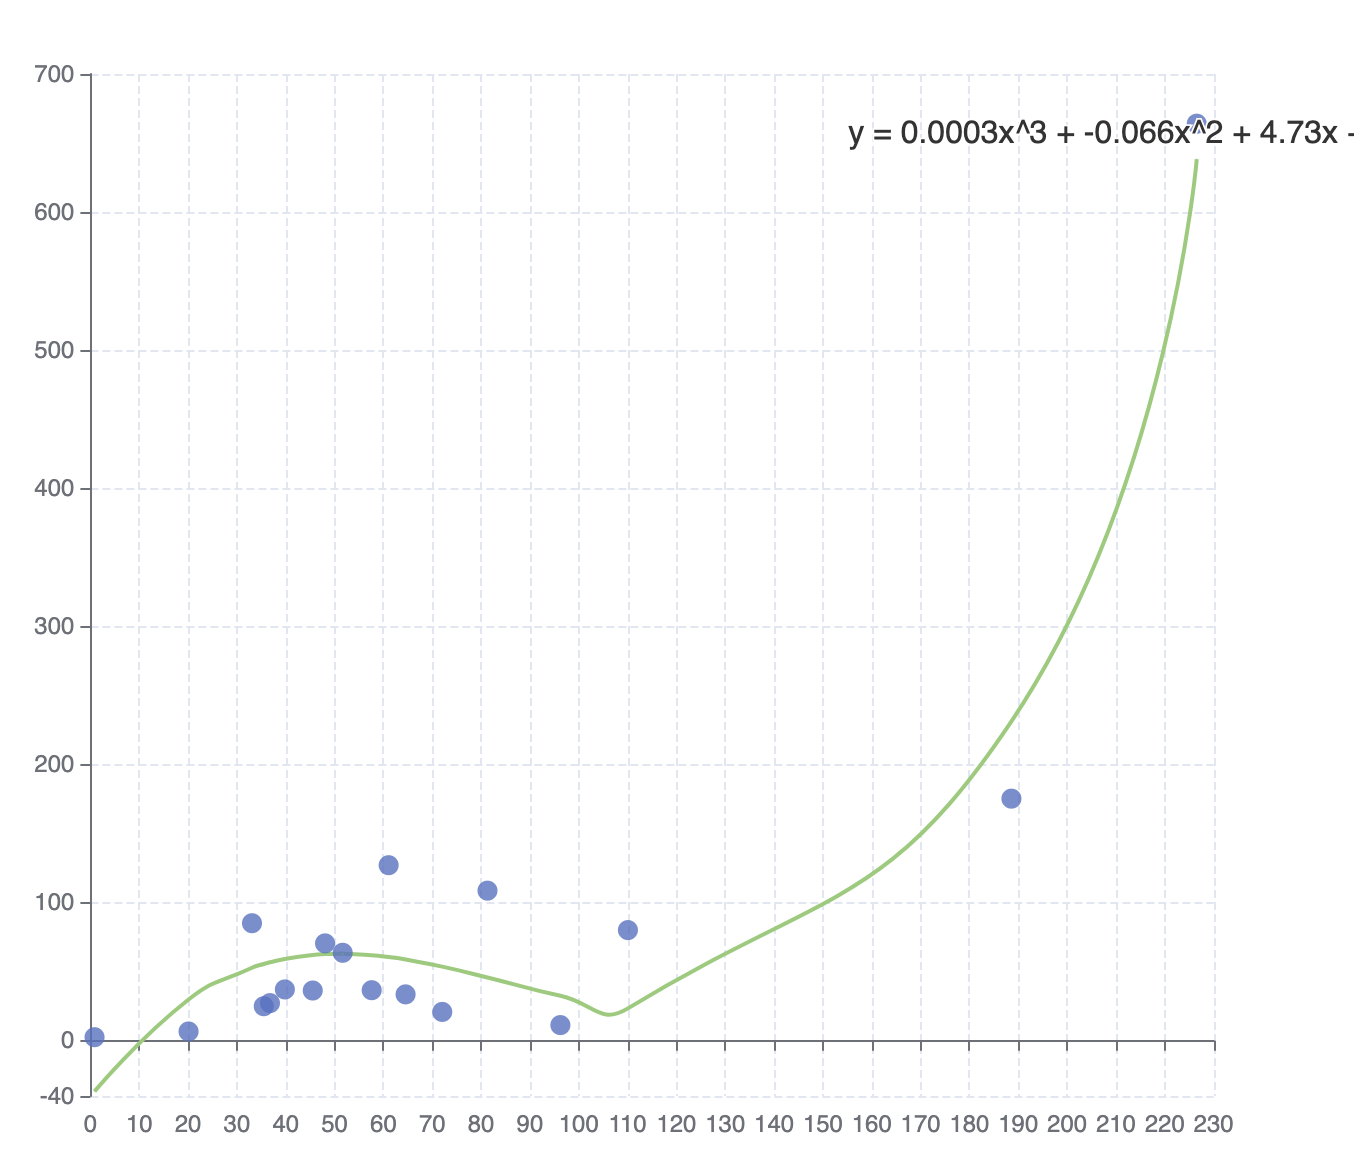
Polynomial Regression
test/transform/regression_polynomial.html
test/standalone/regression_polynomial.html
Statistics
This interface provides basic summary statistical services.
ecStat.statistics.deviation()
Syntax
var sampleDeviation = ecStatstatistics;Parameter
dataList:number[]
Return Value
sampleDeviation:number. Return the deviation of the numeric array dataList. If the dataList is empty or the length less than 2, return 0.
ecStat.statistics.sampleVariance()
Syntax
var varianceValue = ecStatstatistics;Parameter
dataList:number[]
Return Value
varianceValue:number. Return the variance of the numeric array dataList. If the dataList is empty or the length less than 2, return 0.
ecStat.statistics.quantile()
Syntax
var quantileValue = ecStatstatistics;Parameter
dataList:number[]. Sorted array of numbers.p:number. where 0 =< p <= 1. For example, the first quartile at p = 0.25, the seconed quartile at p = 0.5(same as the median), and the third quartile at p = 0.75.
Return Value
quantileValue:number. Return the quantile of the sorted array of numbers. If p <= 0 or the length of dataList less than 2, return the first element of the sorted array dataList; if p >= 1, return the last element of the sorted array dataList; If dataList is empty, return 0.
ecStat.statistics.max()
Syntax
var maxValue = ecStatstatistics;Parameter
dataList:number[]
Return Value
maxValue:number. The maximum value of the dataList.
ecStat.statistics.min()
Syntax
var minValue = ecStatstatistics;Parameter
dataList:number[]
Return Value
minValue:number. The minimum value of the dataList.
ecStat.statistics.mean()
Syntax
var meanValue = ecStatstatistics;Parameter
dataList:number[]
Return Value
meanValue:number. The average of the dataList.
ecStat.statistics.median()
Syntax
var medianValue = ecStatstatistics;Parameter
dataList:number[]. Sorted array of numbers
Return Value
medianValue:number. The median of the dataList.
ecStat.statistics.sum()
Syntax
var sumValue = ecStatstatistics;Parameter
dataList:number[]
Return Value
sumValue:number. The sum of the dataList.