diy-radarchart
Render a radar chart using d3.
example
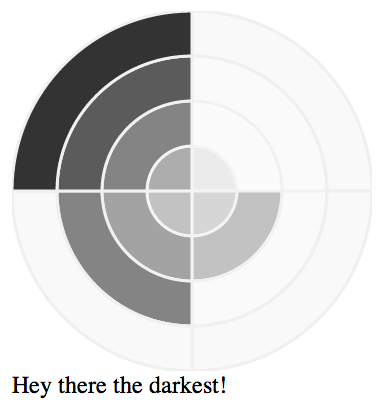
Let's render a chart w/ 4 data points!
var radarchart = require('diy-radarchart');

var target = document.getElementById('passions-chart');

var data = [
    {
        color: '#ccc',
        html: 'Hey there!',
        value: 1
    },
    {
        color: '#999',
        html: 'Hey there darker!',
        value: 3
    },
    {
        color: '#666',
        html: 'Hey there even darker!',
        value: 5
    },
    {
        color: '#333',
        html: 'Hey there the darkest!',
        value: 7
    }
];

radarchart(target, data, { size: 240 });
This would render a radar chart like:
Note that the html is rendered in a .diy-tooltip element
after the svg element and is unstyled in this example.
methods
var radarchart = require('diy-radarchart');
radarchart($el, data, [options])
Appends a svg element and .diy-tooltip element to $el.
$el is the target element. data should be an array of objects with color,
html and value properties.
color is the base color (at 100%) that will generate the various shades for the
given segment.
html is the html used to render within the tooltip element.
value should be the relative integer value to all data points that will be
used to render the segements within the respective data point.
Sample data point:
{
    color: '#999',
    html: '<span>Hey</span>',
    value: 10
}
The chart can handle any number of data points and value amounts
and handles averaging everything.
license
APACHE 2.0