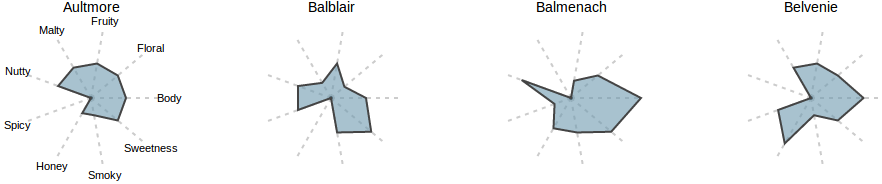
d3-star-plot
d3.starPlot() is designed to be a
reusable chart generator with sane
defaults and the necessary customization options. It encourages familiar
d3 design patterns to make building a series of star plots simple.
var star = d3.starPlot()
  .properties([
    'Body',
    'Sweetness',
    'Smokey'
  ])
  .scales(scale);
  .labels([
    'Body',
    'Sweetness',
    'Smokey'
  ])

data.forEach(function(d) {
  d3.select(body).append('svg')
    .datum(d)
    .call(star)
});
Example
To run the included example locally:
$ npm install
$ grunt
Open http://0.0.0.0:8000 in your browser.
Downloads
API
d3.starPlot()
Constructs a new star plot. The returned function generates svg elements to create a star plot, including axis lines, labels, an origin circle and the star plot path according to the associated data.
var star = d3.starPlot();
star.properties([properties])
If properties is specificed, sets the datum properties to use in the
specified star plot. If properties is not specificed, returns the
current properties. These must be set for the returned star plot
generator to produce a worthwhile chart.
properties must be an array of String objects corresponding to
properties of the datum. The order of properties determines the
clockwise order of attributes to be drawn with the returned star plot
generator.
star.properties([
  'Body',
  'Sweetness',
  'Smokey'
]);
star.scales([scales])
If scales is specificed, sets the scale functions for the
specified star plot. If scales is not specificed, returns the
current scale functions. scales must be set for the returned star plot
generator to produce a worthwhile chart.
scales must be either a single d3.scale function or an array of
d3.scale functions for the star plot's associated data. It is used in
conjunction with properties to compute the shape of the resulting star
plot. Each scale in scales should give the properties data the range
[0, 100]. If a single scale is specified, it will be used for all
properties. If an array of scales is specified, the order of scales
should match the order of properties.
var scale = d3.scale.linear()
  .domain([0, 4])
  .range([0, 100])

// This ...
star.scales(scale);

// ... is equivalent to this
star.scales([
  scale,
  scale,
  scale
])
star.labels([labels])
If labels is specificed, sets the attriute labels for the
specified star plot. If labels is not specificed, returns the
current labels. This value is optional.
labels must be an array of strings in the order that the corresponding
accessor functions are in.
star.labels([
  'Body',
  'Sweetness',
  'Smokey'
]);
star.labelMargin([m])
If m is specificed, sets the margin of the specified star plot. If m
is not specificed, returns the current label margin value. This value is
used to place data labels farther from the origin. The default value is
20.
star.labelMargin(20);
star.width([w])
If w is specificed, sets the width of the specified star plot. If w
is not specificed, returns the current width value. Because star plots
are square, the width value is also used for the height of the star
plot. The default value is 200.
star.width(200);
star.margin([m])
If m is specificed, sets the margin of the specified star plot. If m
is not specificed, returns the current margin value. m must be an
object with top, right, bottom and left properties. By default,
these values are all 0.
var m = {
  top: 0,
  right: 0,
  bottom: 0,
  left: 0
};
star.margin(m);
star.includeGuidelines([boolean])
If boolean is specificed, sets the value. If boolean
is not specificed, returns the current label margin value. If this value
is true, the returned star plot generator will include lines from the
origin to the value of each of the data's attributes. The default value
is true.
star.includeGuidelines(true);
star.title([title])
If title is specificed, sets the title accessor function of the
specified star plot. If title is not specificed, returns the current
title accessor function. The value returned by this function is used by
the returned star plot generator to label the chart.
star.title(function(d) { return d.Distillery; });
star.interaction()
Returns an interaction generator to be used in conjunction with the star plot generator. The returned function will build an overlay useful for attaching interaction events to.
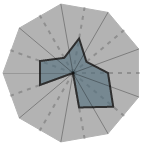
The image above shows the interaction overlay in gray. Each property is separated by a solid line. These triangles are useful for attaching mouse events to.
An event attached to a generation of interaction will include the
following properties:
- key: The property associated with this event
- datum: The datum associated with the star plot. This can be
combined with
keyto find the datum value associated with this event. - x: The x coordinate of the value on the star plot
- y: The y coordinate of the value on the star plot
- xExtent: The x coordinate of the maximum possible value on the star plot
- yExtent: The y coordinate of the maximum possible value on the star plot
Note: These coordinates consider 0,0 to be the top, left space in the associated svg element.
svg.append('g')
  .datum(d)
  .call(star)
  .call(star.interaction)
The example included locally and the live demo both have a full example.