d3-es-geohashgrid
A reusable d3 chart to display data from an elasticsearch GeoHash grid Aggregation.
Installing
If you use NPM, npm install d3-es-geohashgrid. Otherwise, download the latest release.
You will also need to have a json file of the map that you want to render, which is not included in this library. Odds are you are going to want this file but the library can work with any topojson parseable file.
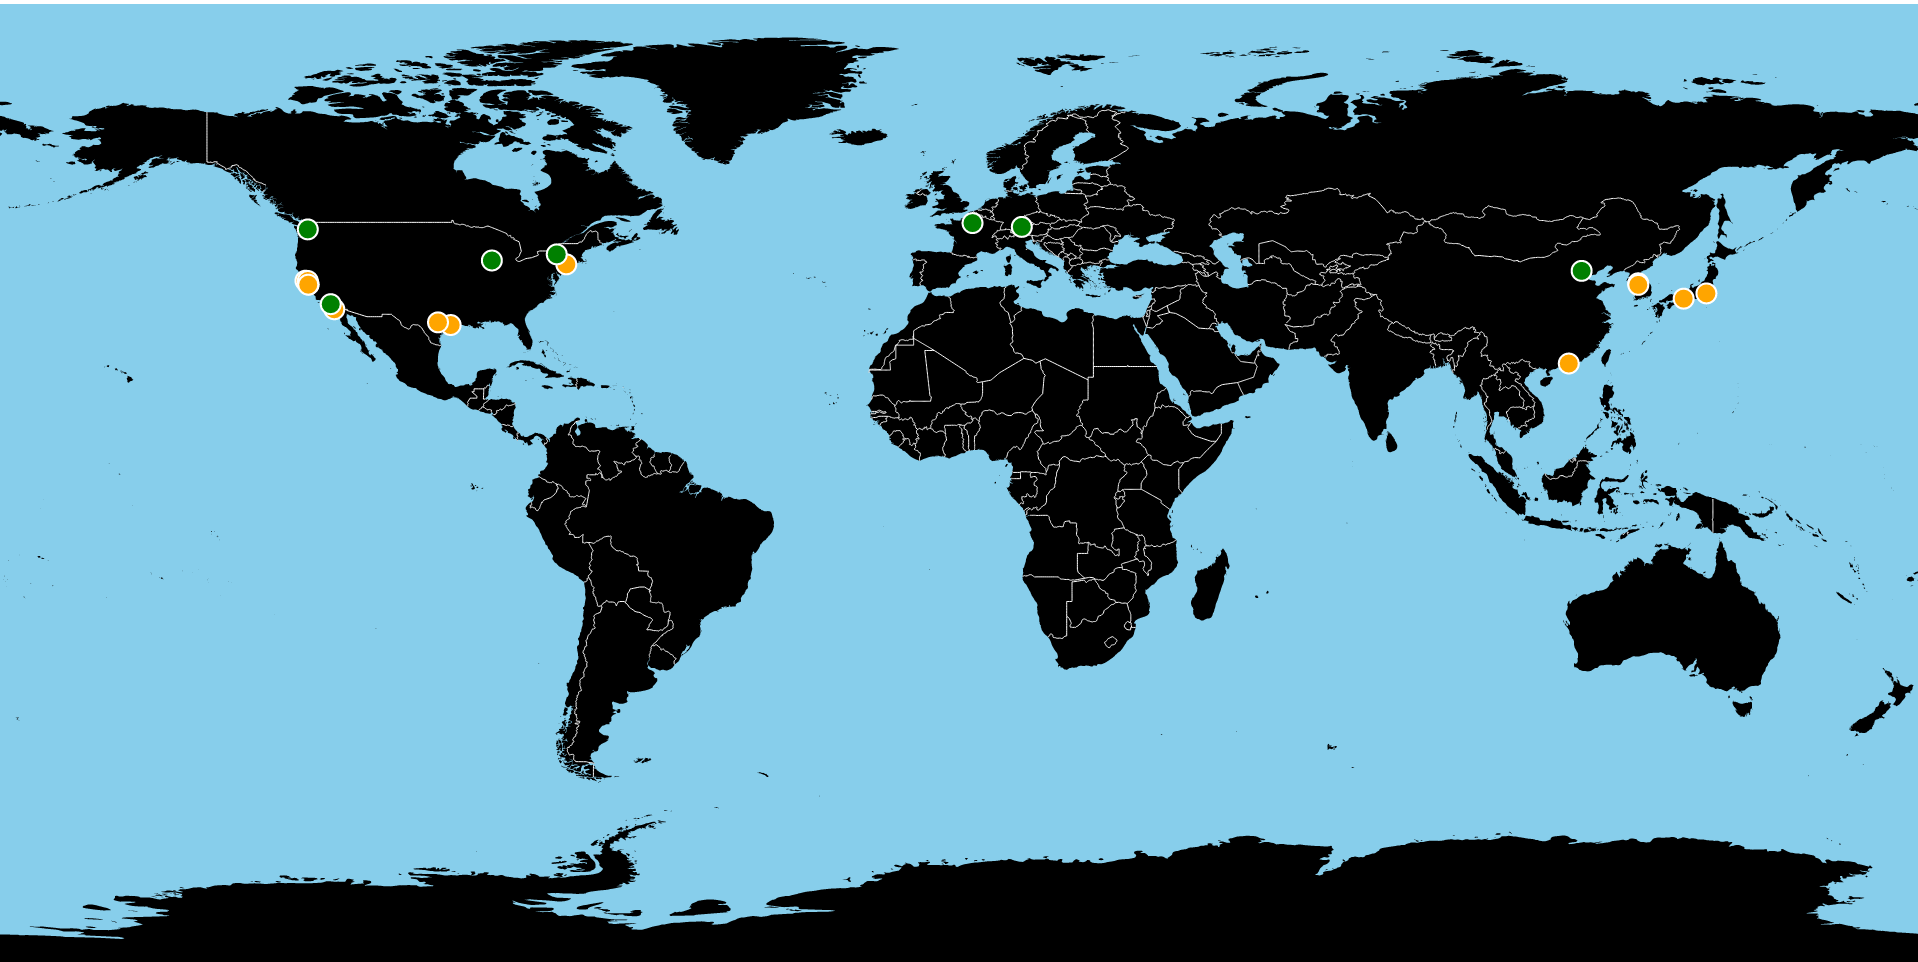
Behavior
The library is in chart of drawing the map and placing the pins on the svg, but does not concern itself with styling.
// data that you would get from elasticsearch

var sample_data = {my_aggregation: {
  buckets: [{
    'key': 'svz',
    'doc_count': 10964
  }, {
    'key': 'sv8',
    'doc_count': 3198
  }]
}};

var width = 960,
    height = 480;

// remember that this json file is not included with the library
// you will need to find your own
d3.json('./world-50m.json', function(error, topology) {

  var geo_chart = d3_es_geohashgrid.geohashgrid()
                .data(sample_data.my_aggregation)
                .topology(topology)
                .width(width)
                .height(height);


  // draw the chart
  var svg = d3.select('body').append('svg')
    .attr('width', width)
    .attr('height', height)
    .call(geo_chart);

  // style the pins at needed
  svg.selectAll('.pin')
    .attr('r', 5)
    .style('fill', function(d) {
      return d.doc_count > 5000 ? 'red' : 'green';
    });
});
API Reference
d3_es_geohashgrid.geohashgrid()
Returns a function callable by d3 to render a world chart of locations from the geohashgrid aggregation.
var chart = d3_es_geohashgrid.geohashgrid();.width([val])
Sets or returns the width of the chart.
.height([val])
Sets or returns the height of the chart.
.topology([val])
Sets or returns the topology (parseable by topojson) to render to the map. Note that there is no topology included with this library and you will need to find one yourself to make this useful to you.
.landClass([val = 'land'])
Sets or returns the class assigned to the svg path that draws the land.
.borderClass([val = 'border'])
Sets or returns the class assigned to the svg path that draws country borders.
.pinClass([val = 'pin'])
Sets or returns the class assigned to the svg circle that draw the aggregation points.
.data([val])
Sets or returns the data that will be used to place the pins.
License
MIT