
![]()
Contrail Charts
A chart library by Contrail using D3 and Backbone. Please see contrail-charts-demo for more examples using this library.
Getting Started
Prerequisites
Node version > 6
Installation
If you are using NPM, use
npm install contrail-charts
Otherwise, download the latest release and run the following command.
These instructions will get you a copy of the project up and running on your local machine for development and testing purposes.
npm install
To build, use
npm run build
You'll find the js and css under build/ directory.
Development
For dev environment, use
npm run dev
This will build and load the examples on browser at http://localhost:9000.
To run unit tests, use
npm run test
Under CI infrastructure, we use phantomjs. If you want to run under headless browser:
npm install -g phantomjs-prebuilt and do npm run test-headless
Documentation
Refer documentation for different types of charts, components and their config options.
Examples
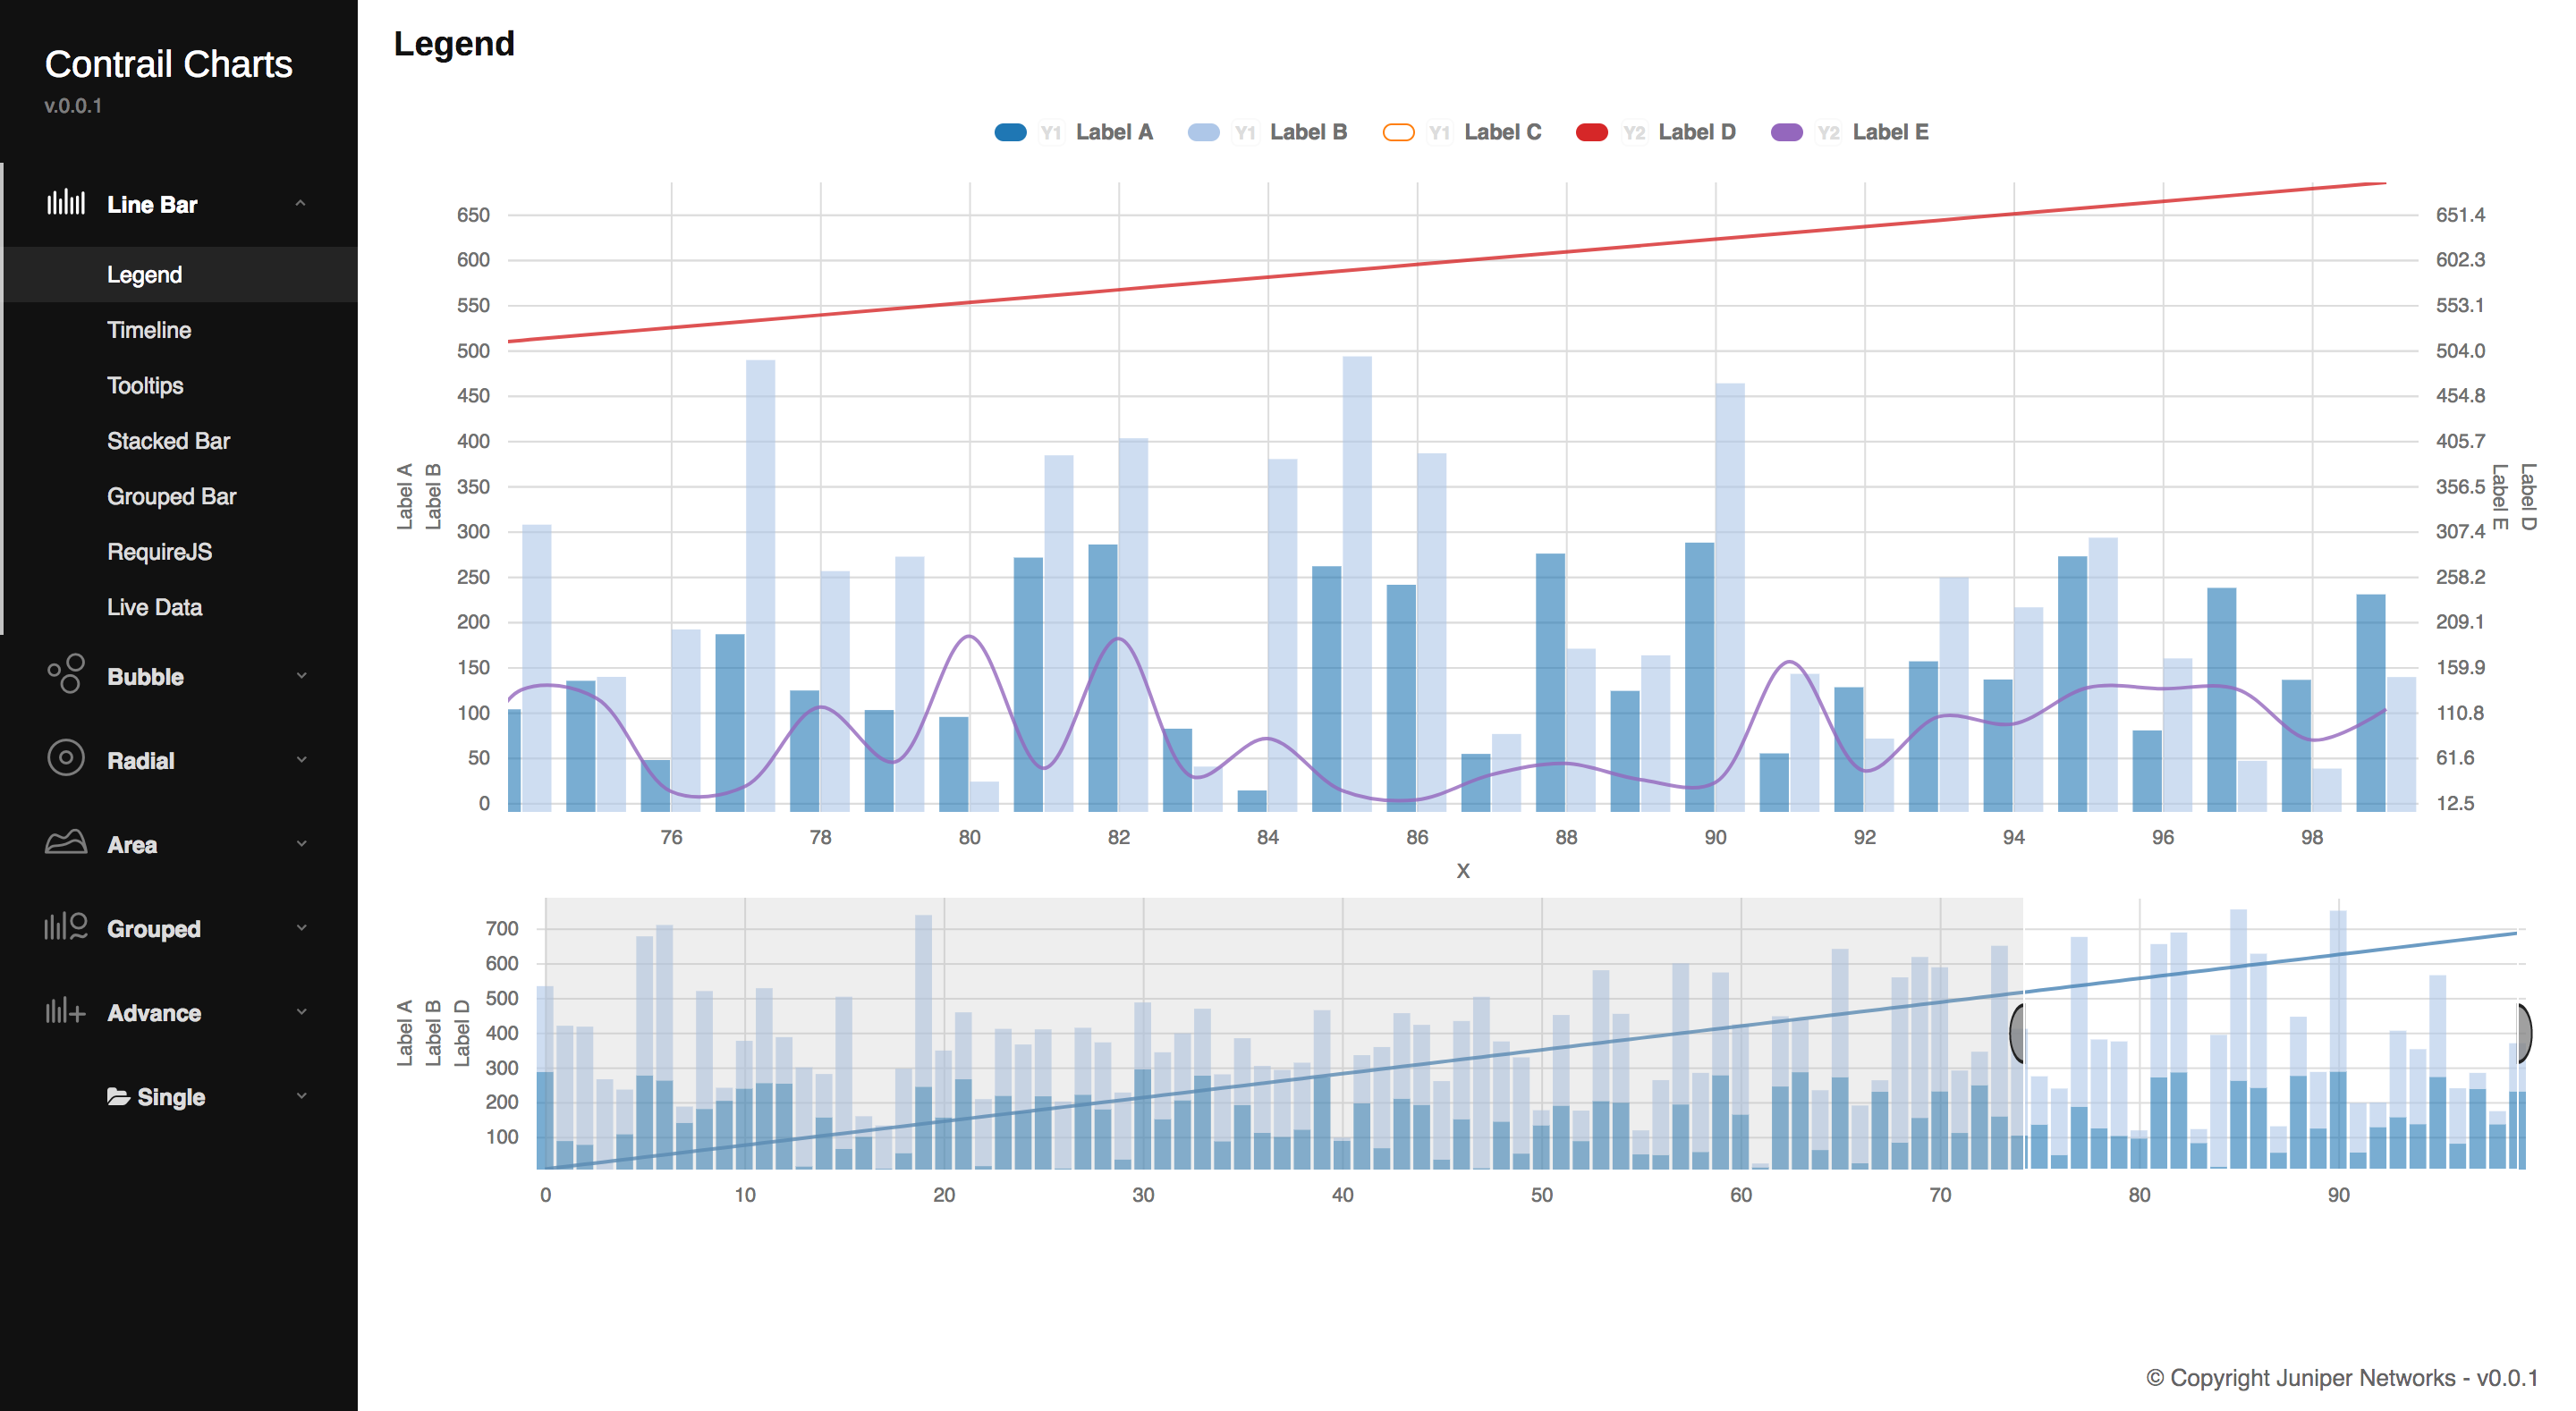
Line Bar Chart
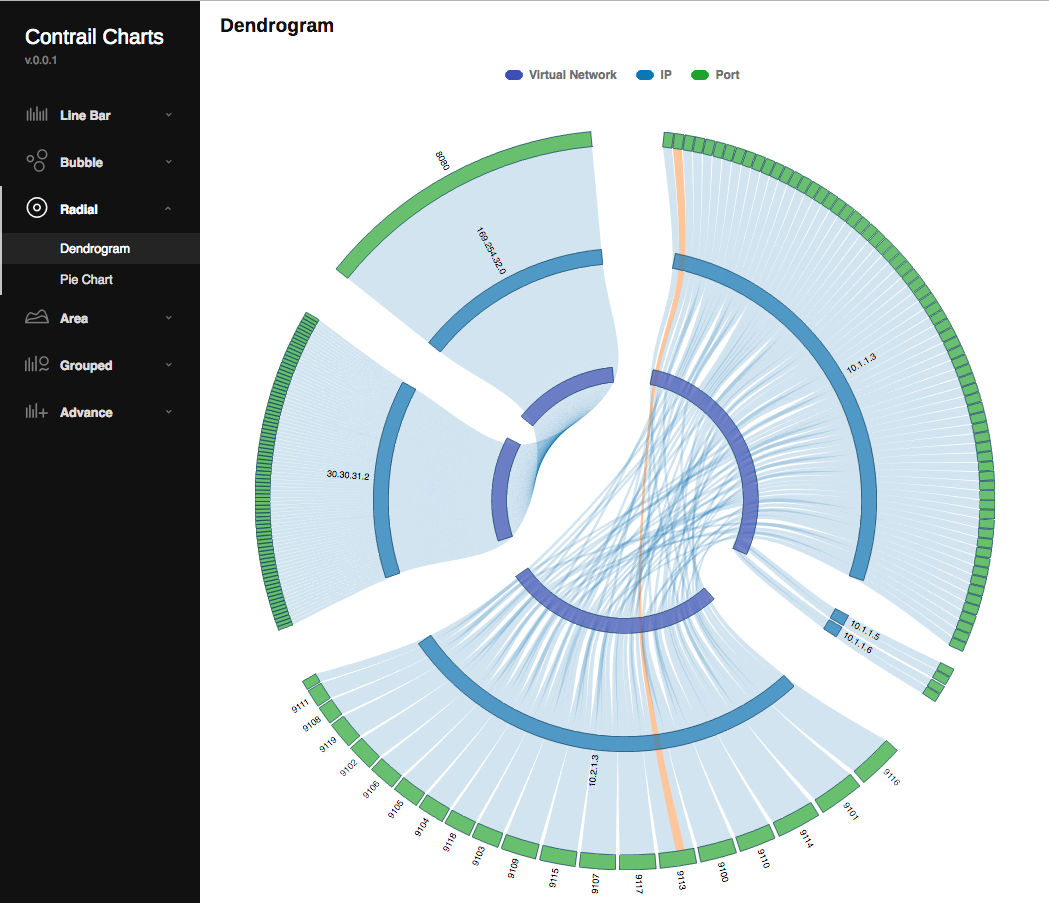
Radial Dendrogram Chart
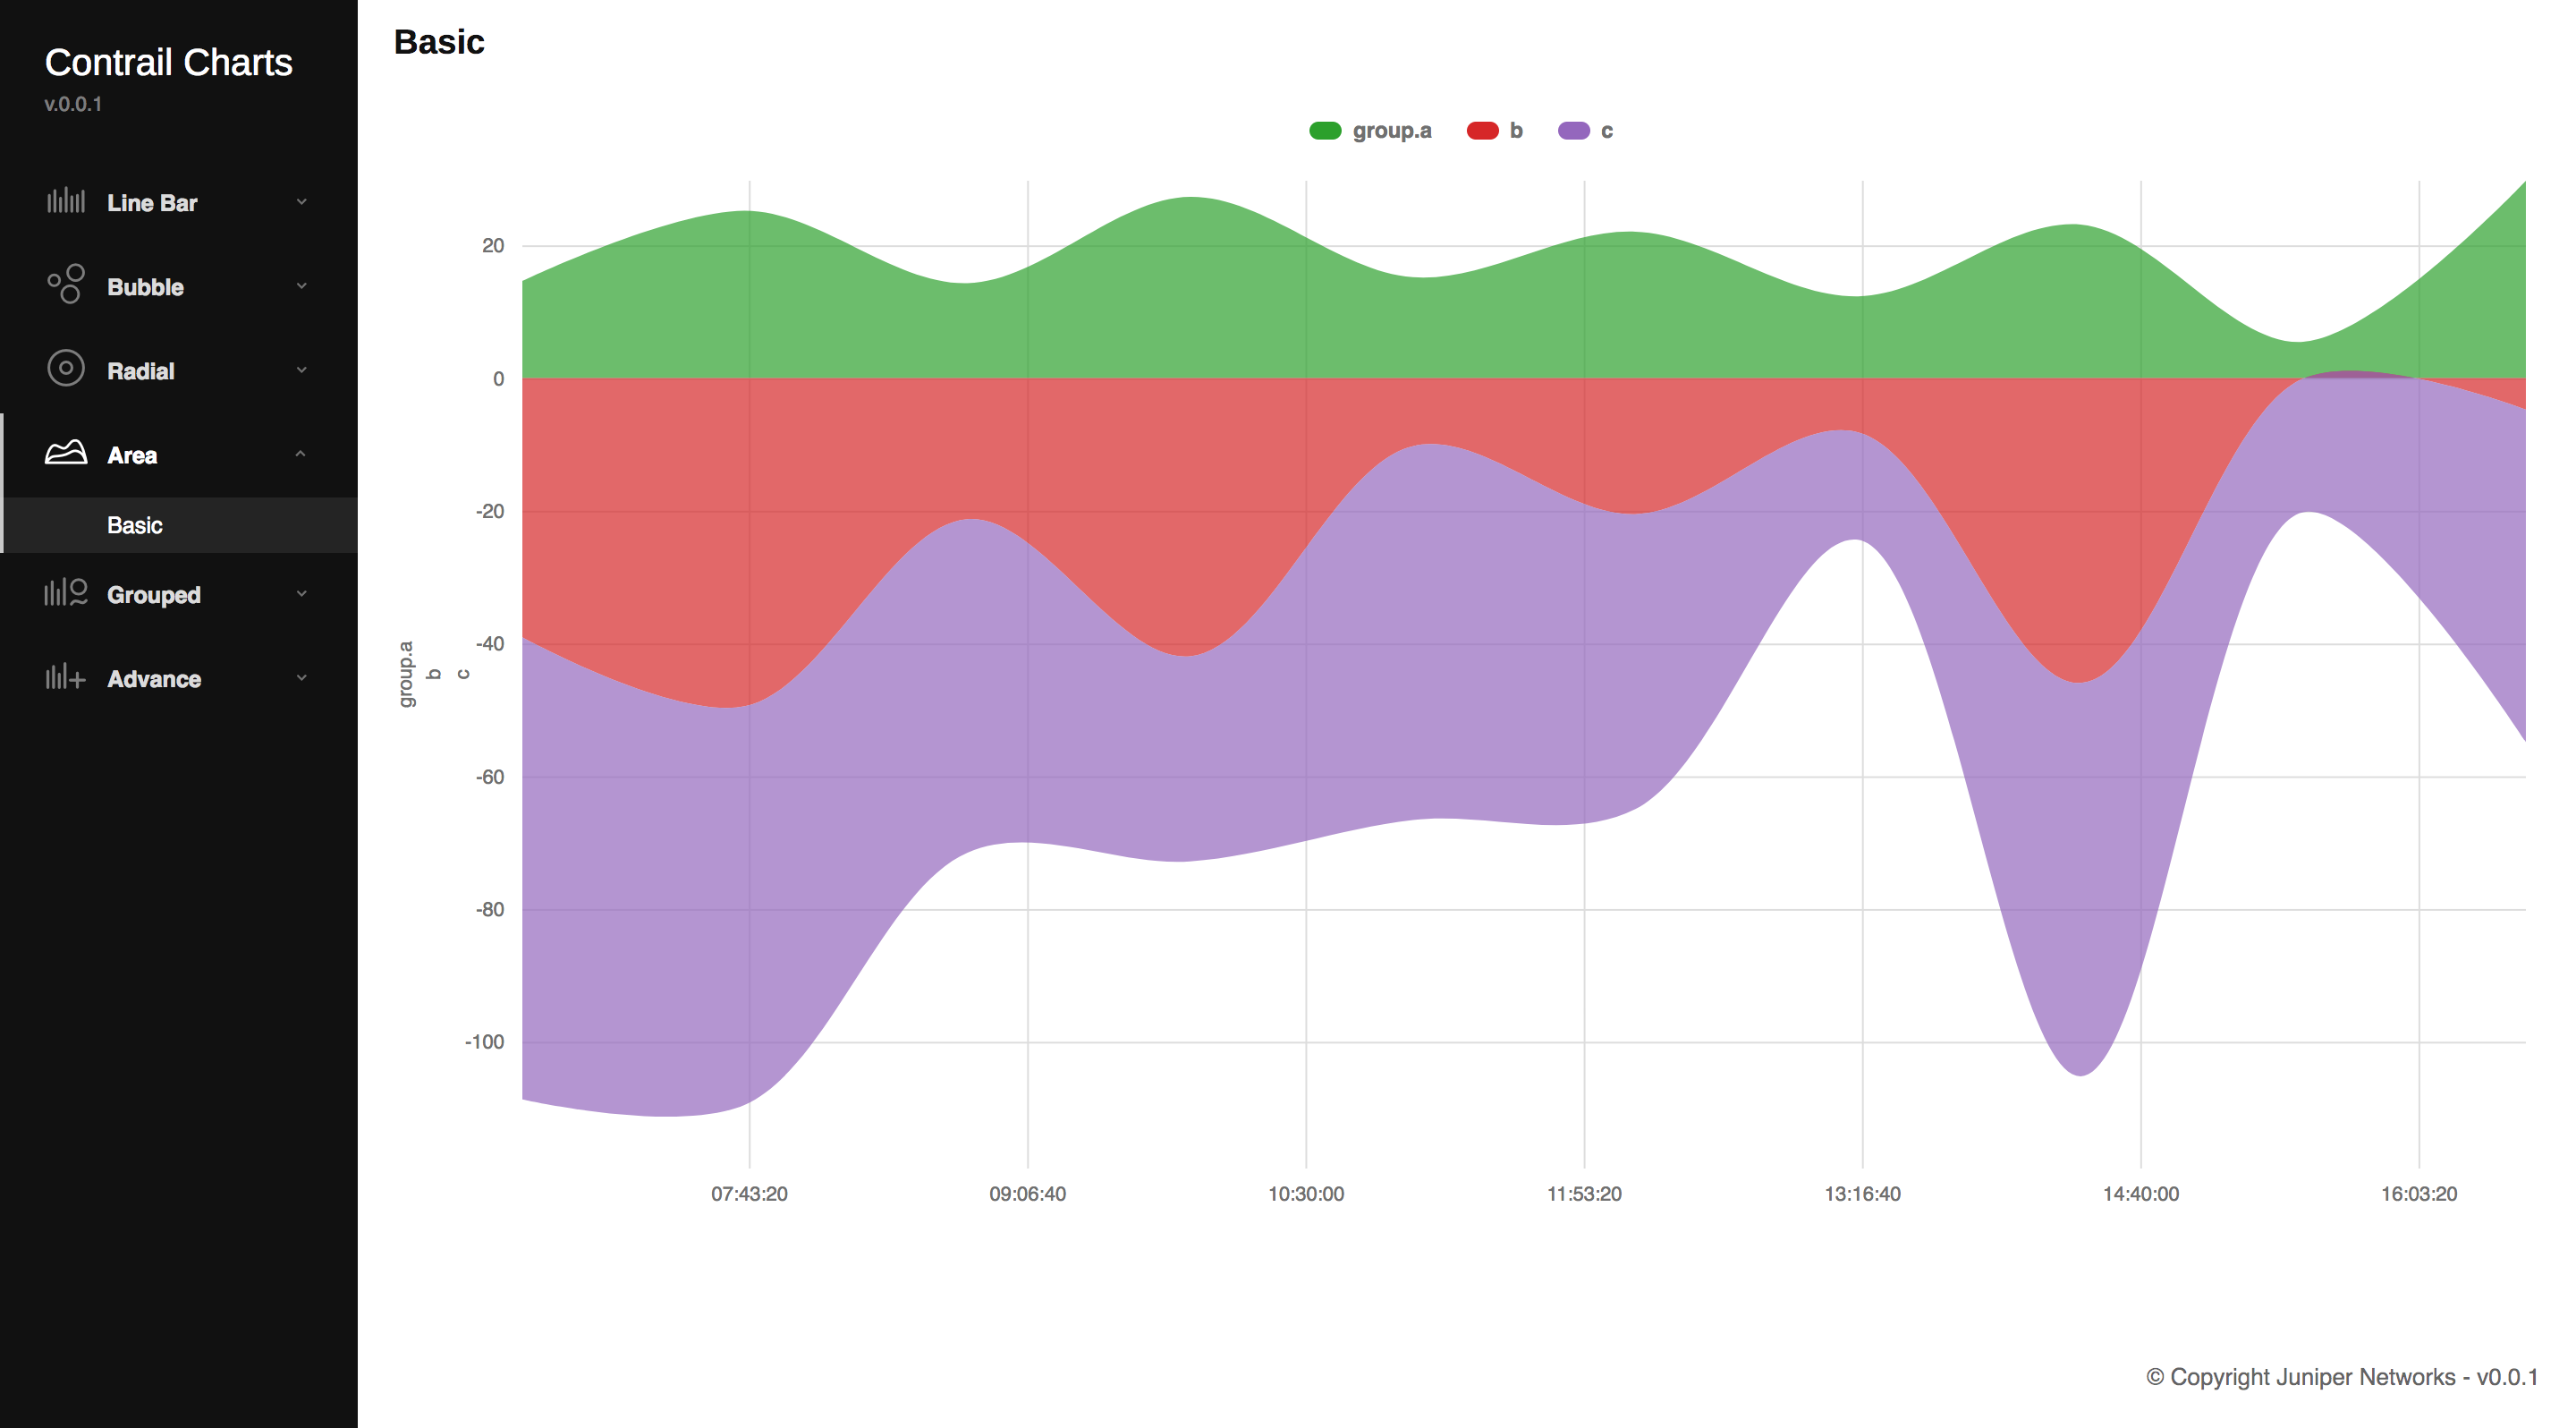
Area Chart
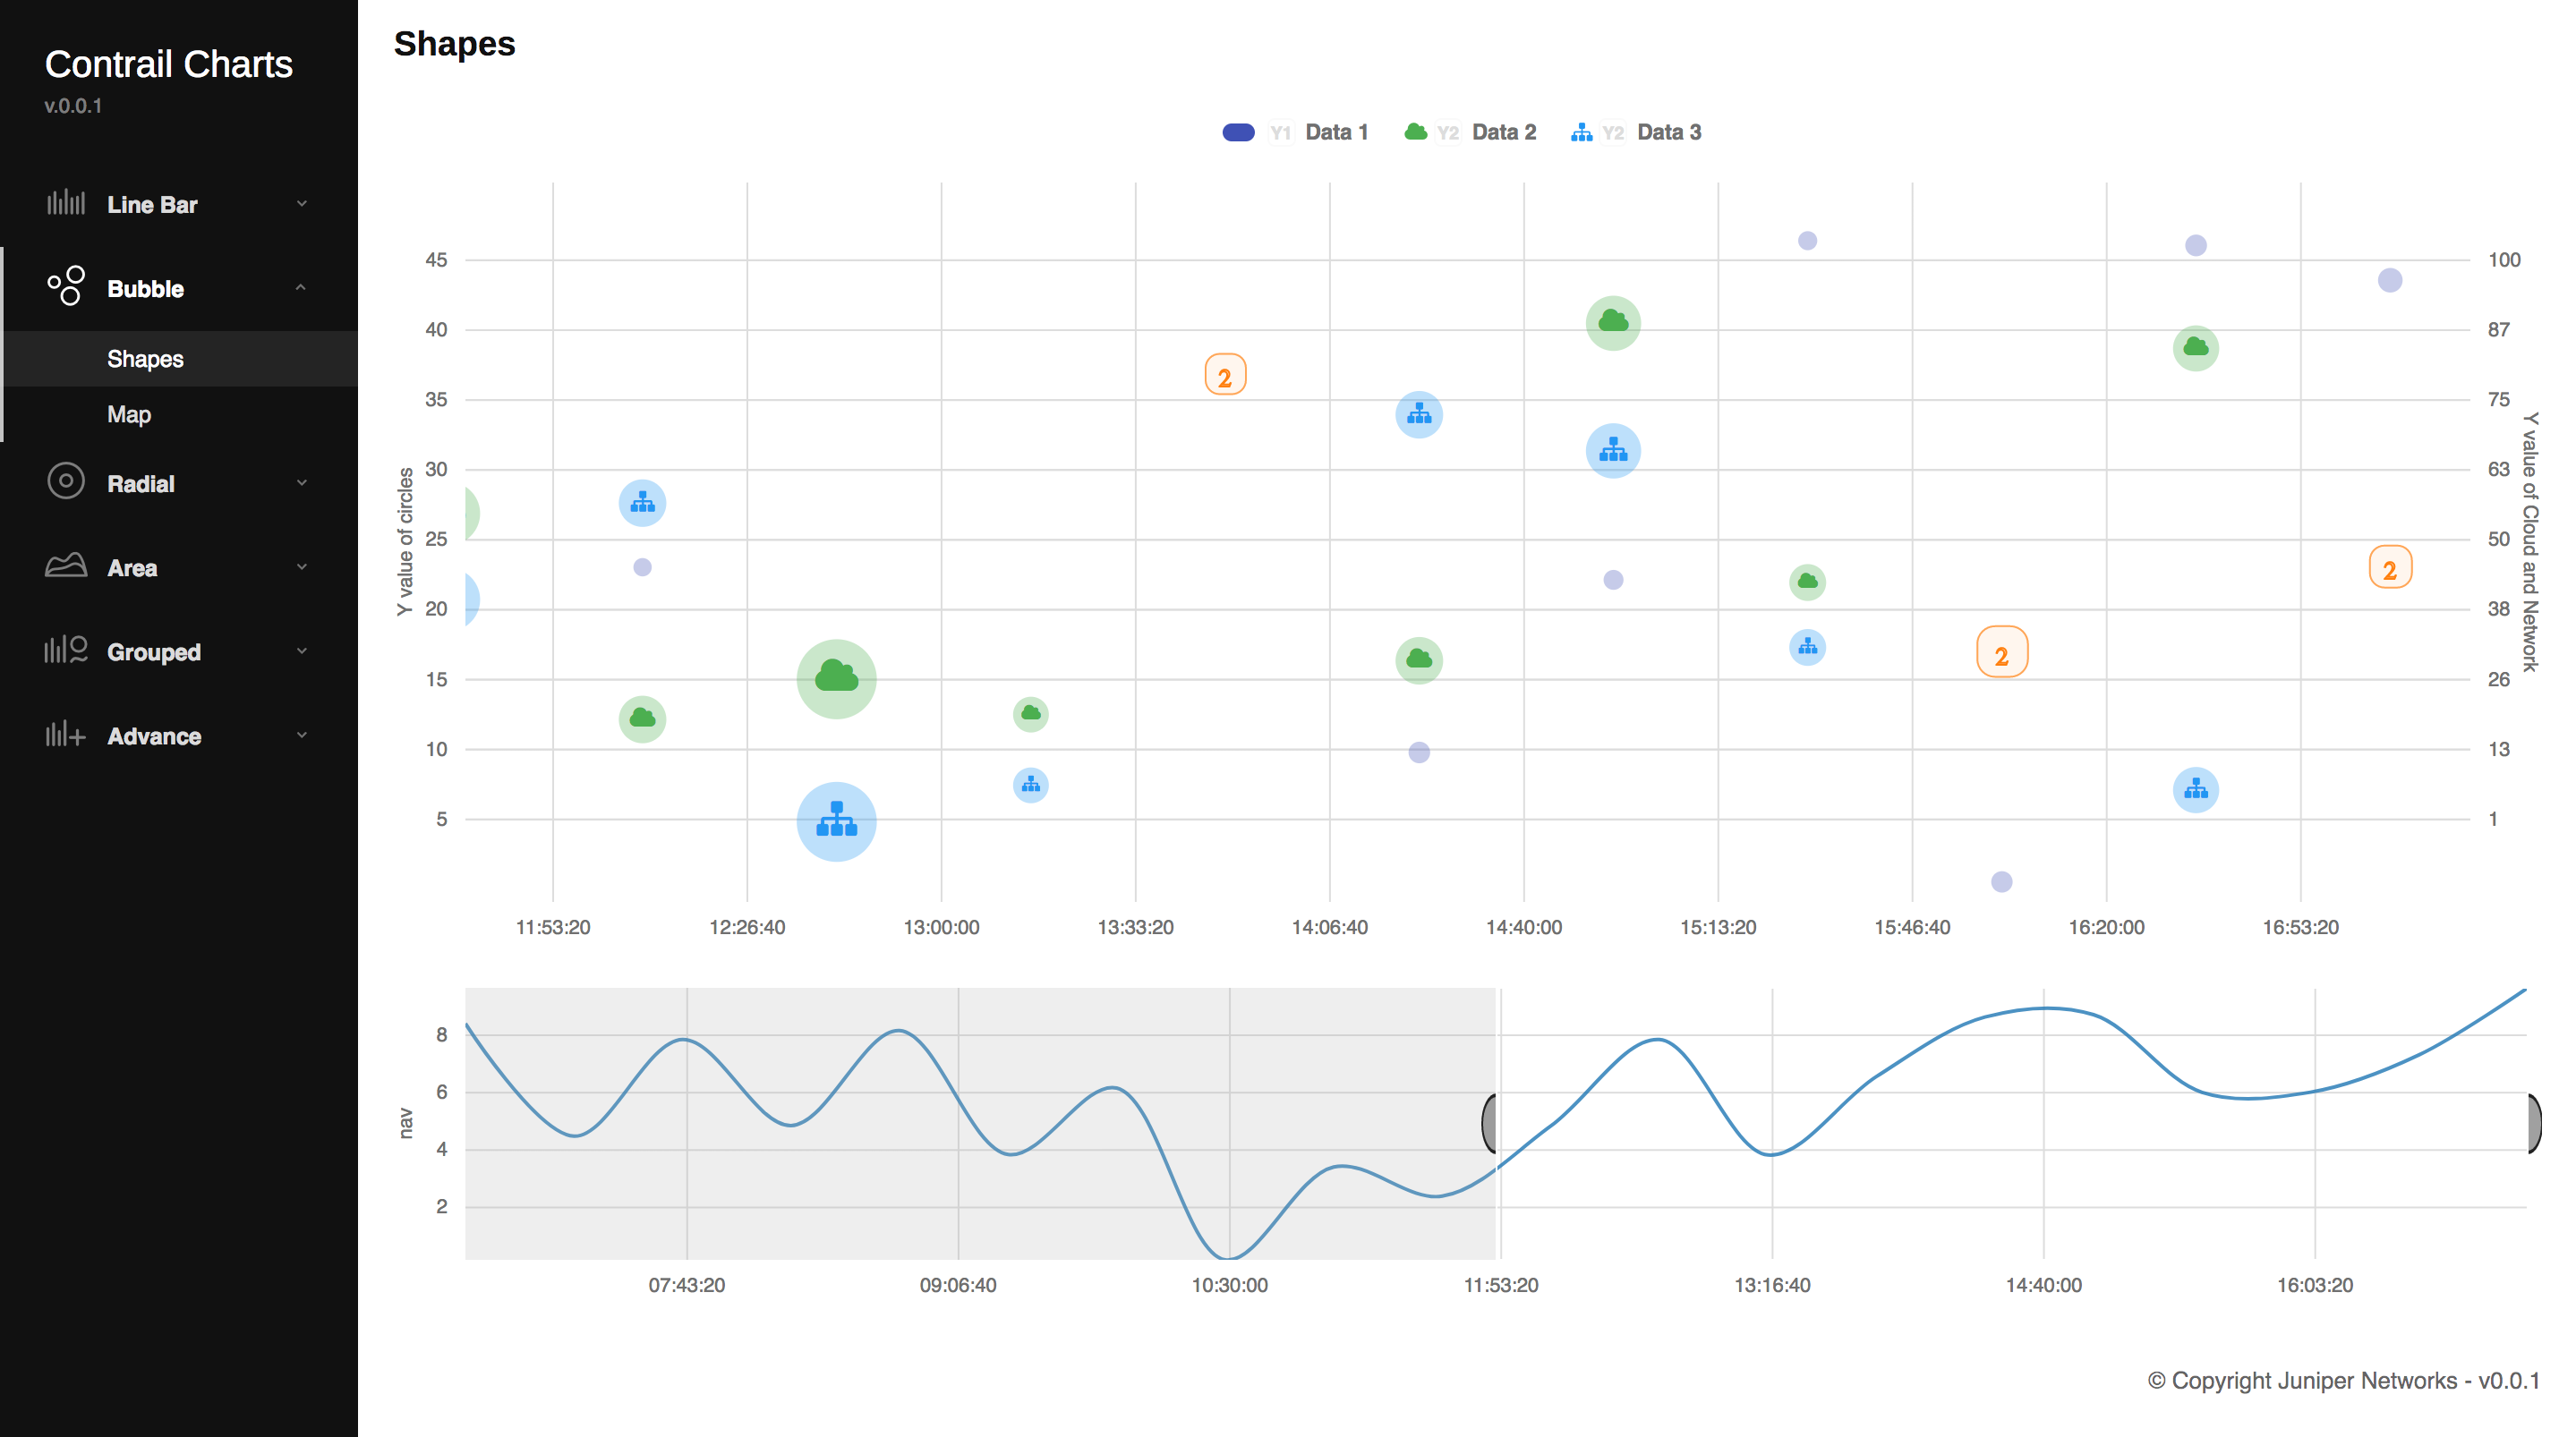
Bubble Chart
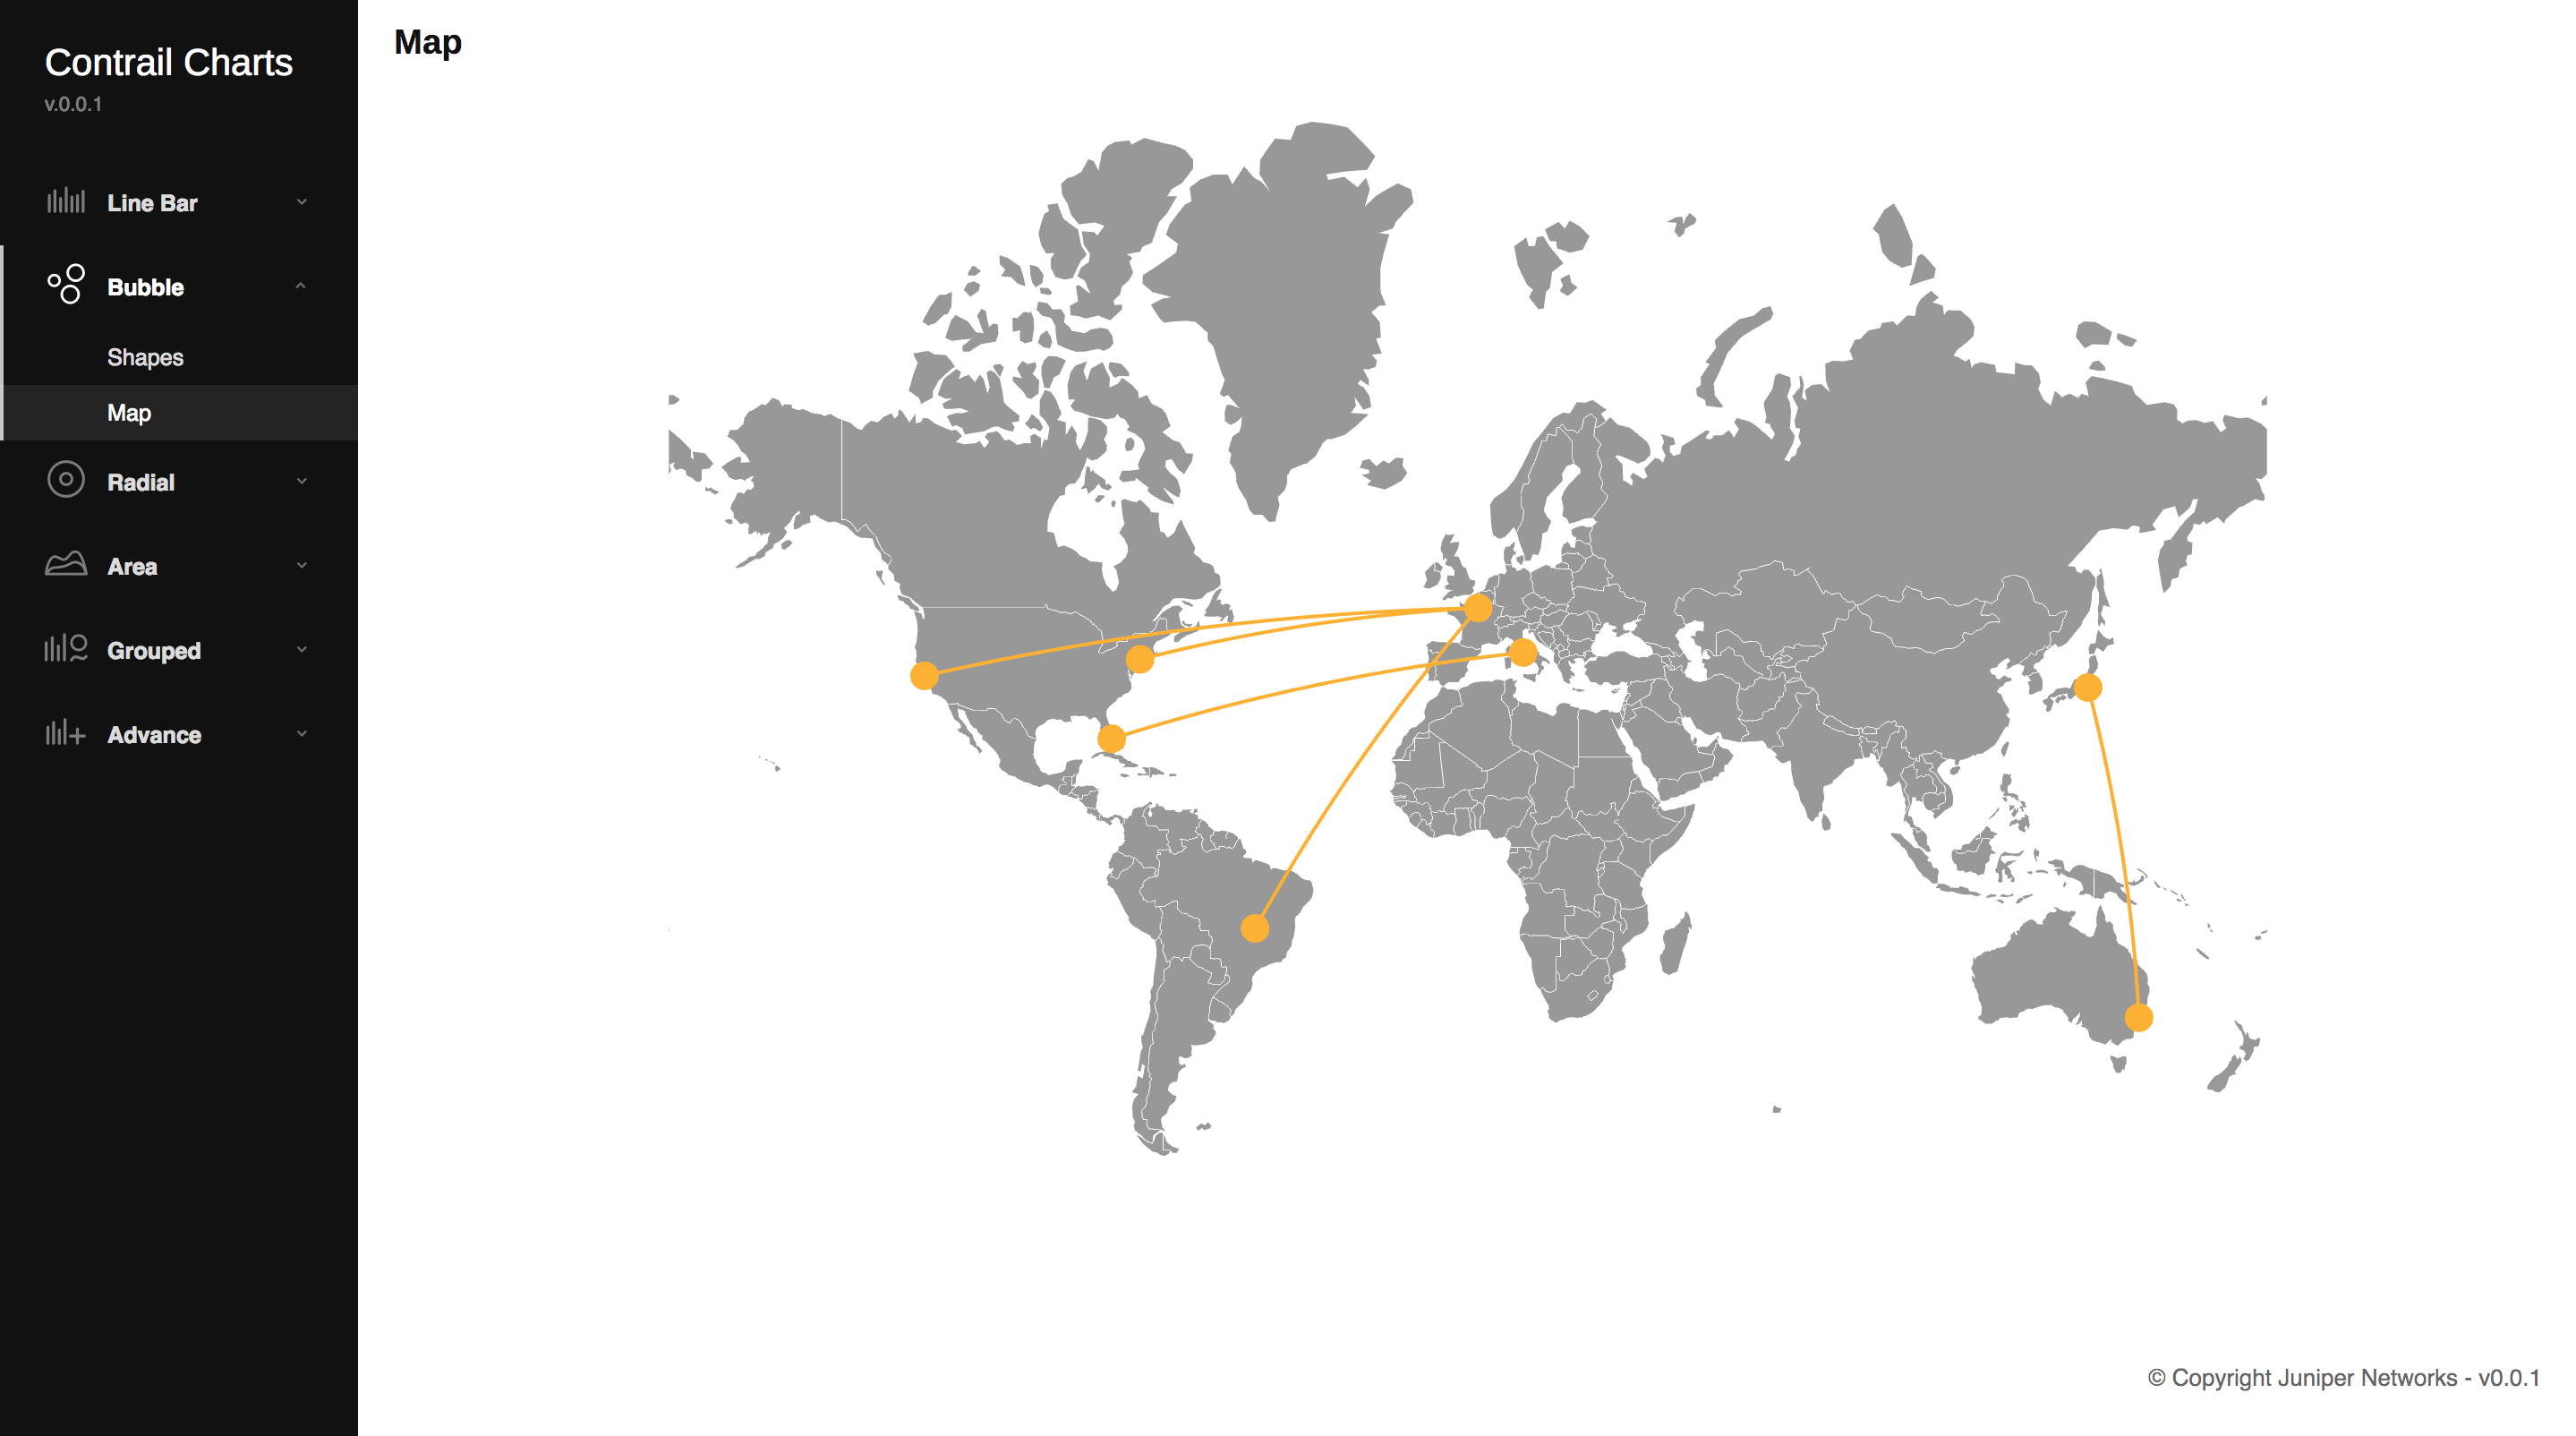
Bubble Map
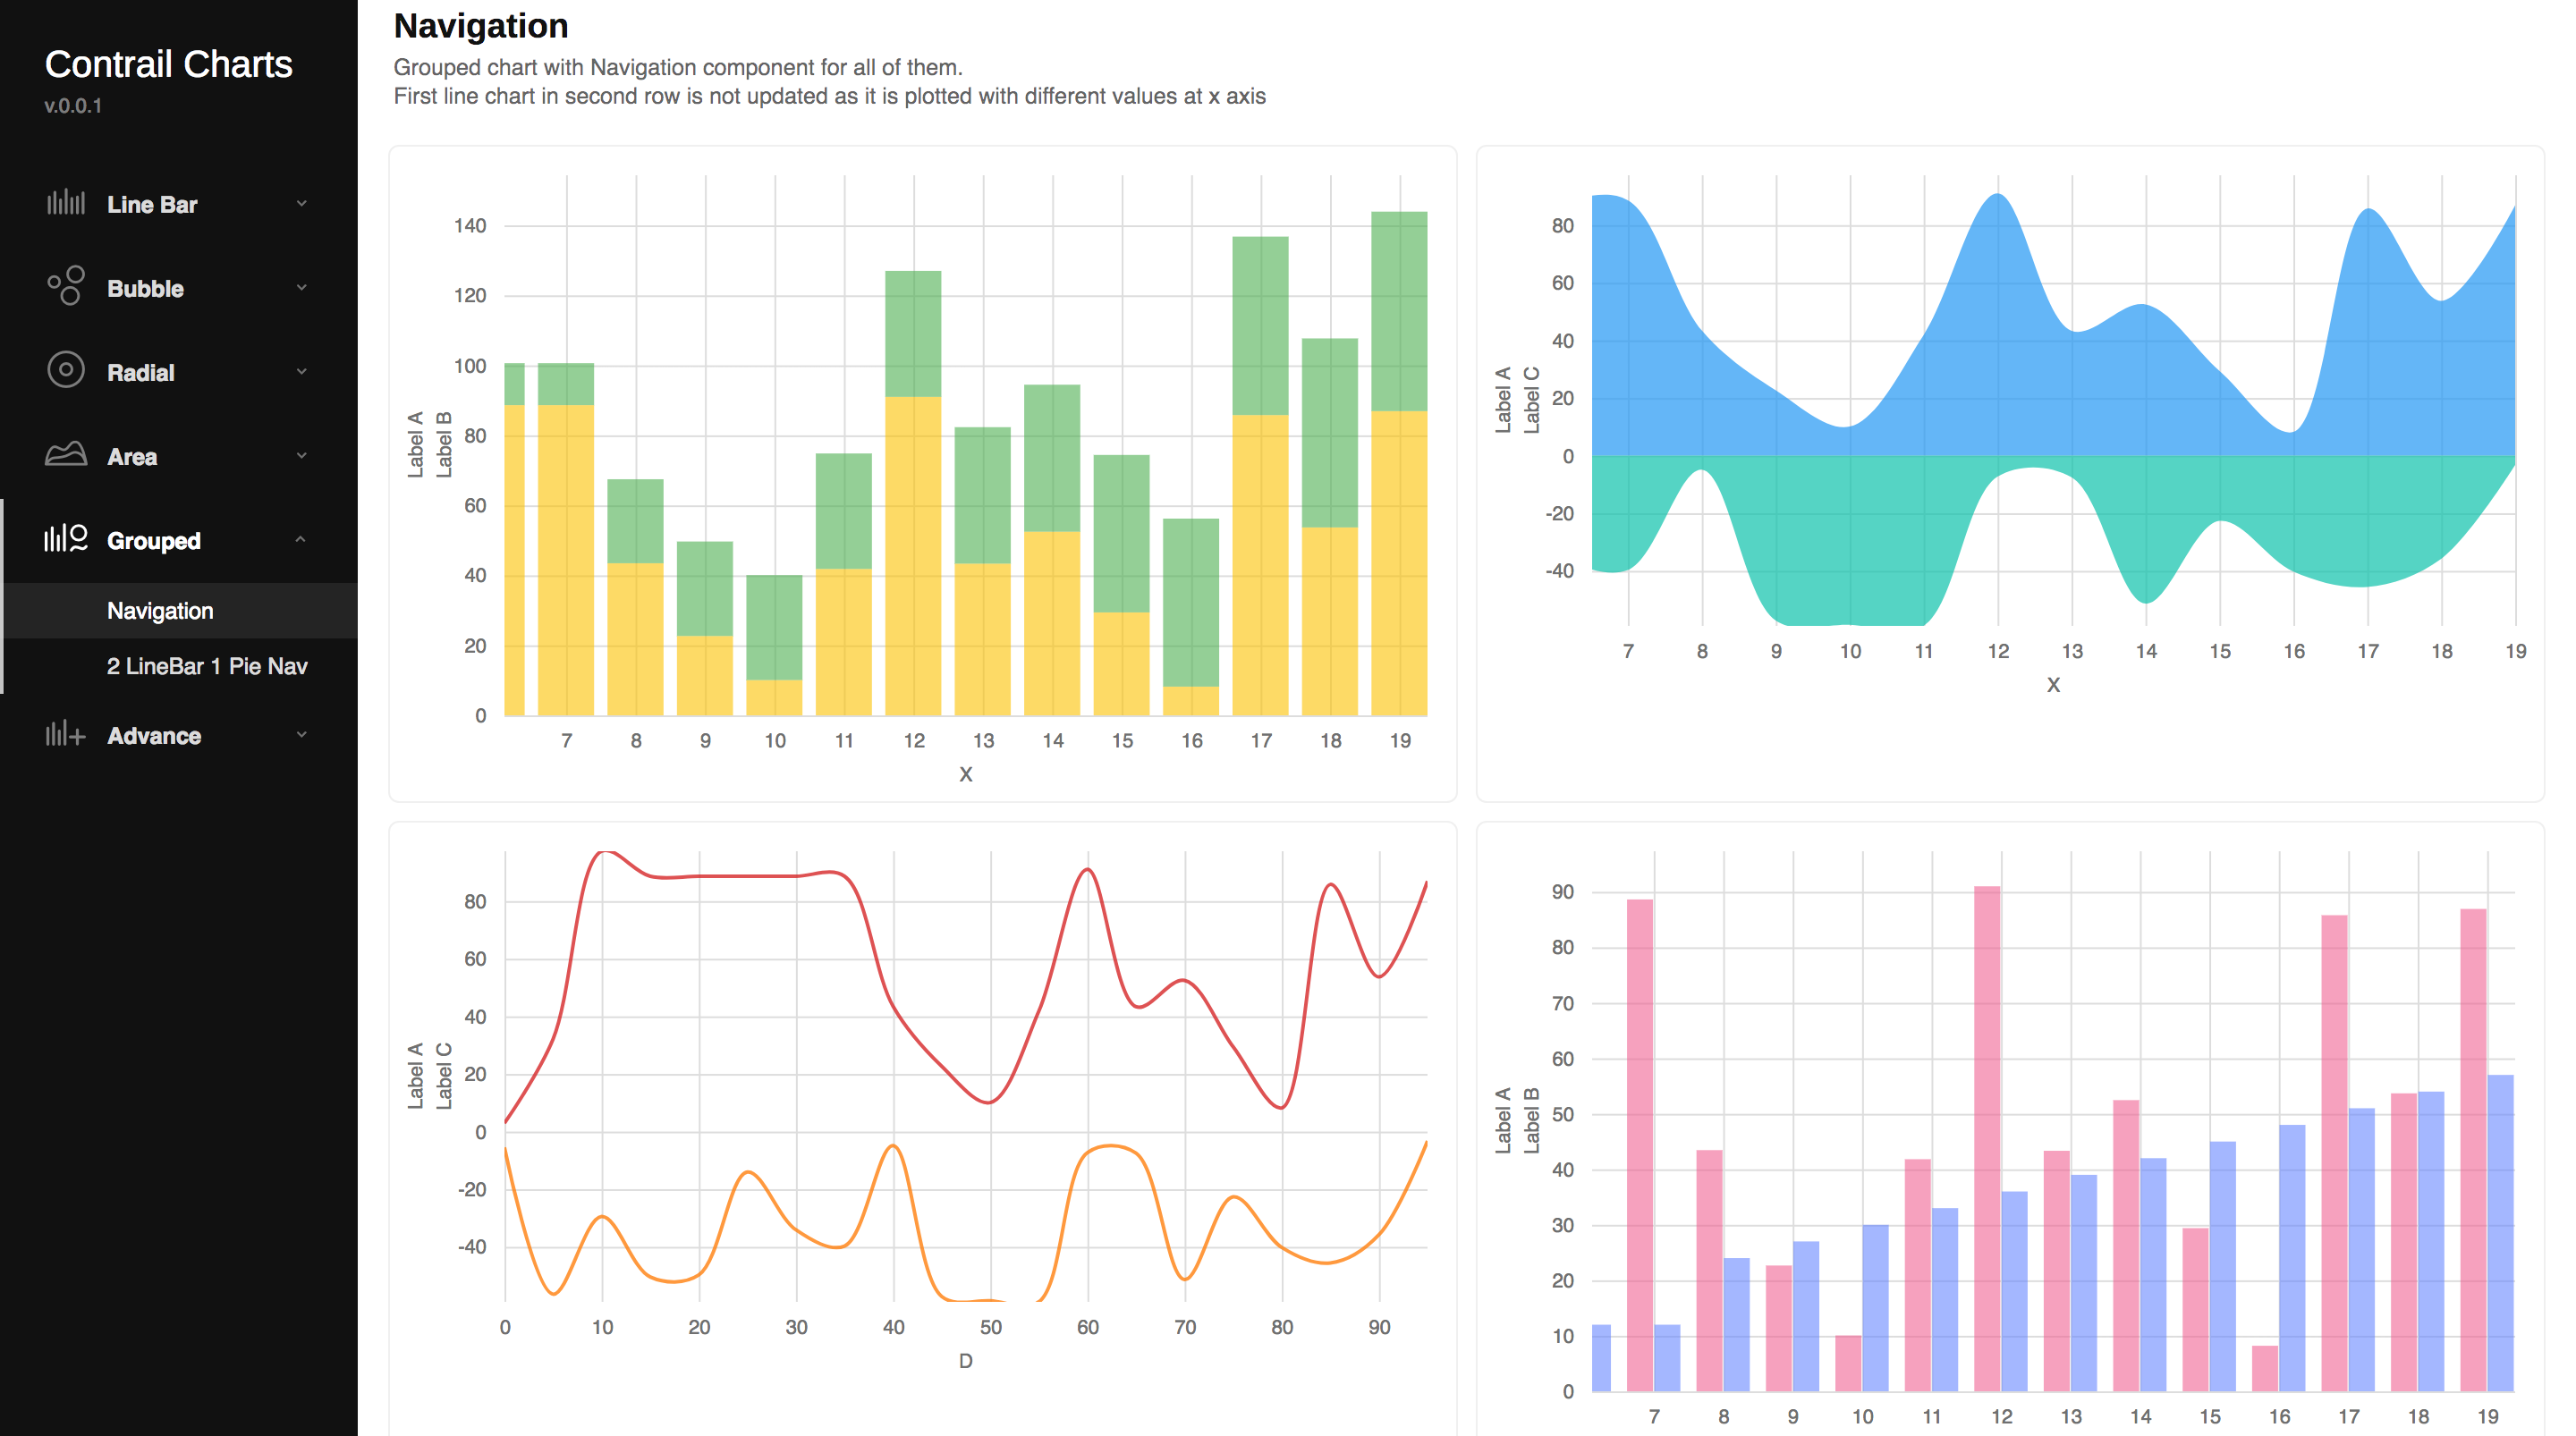
Grouped Chart
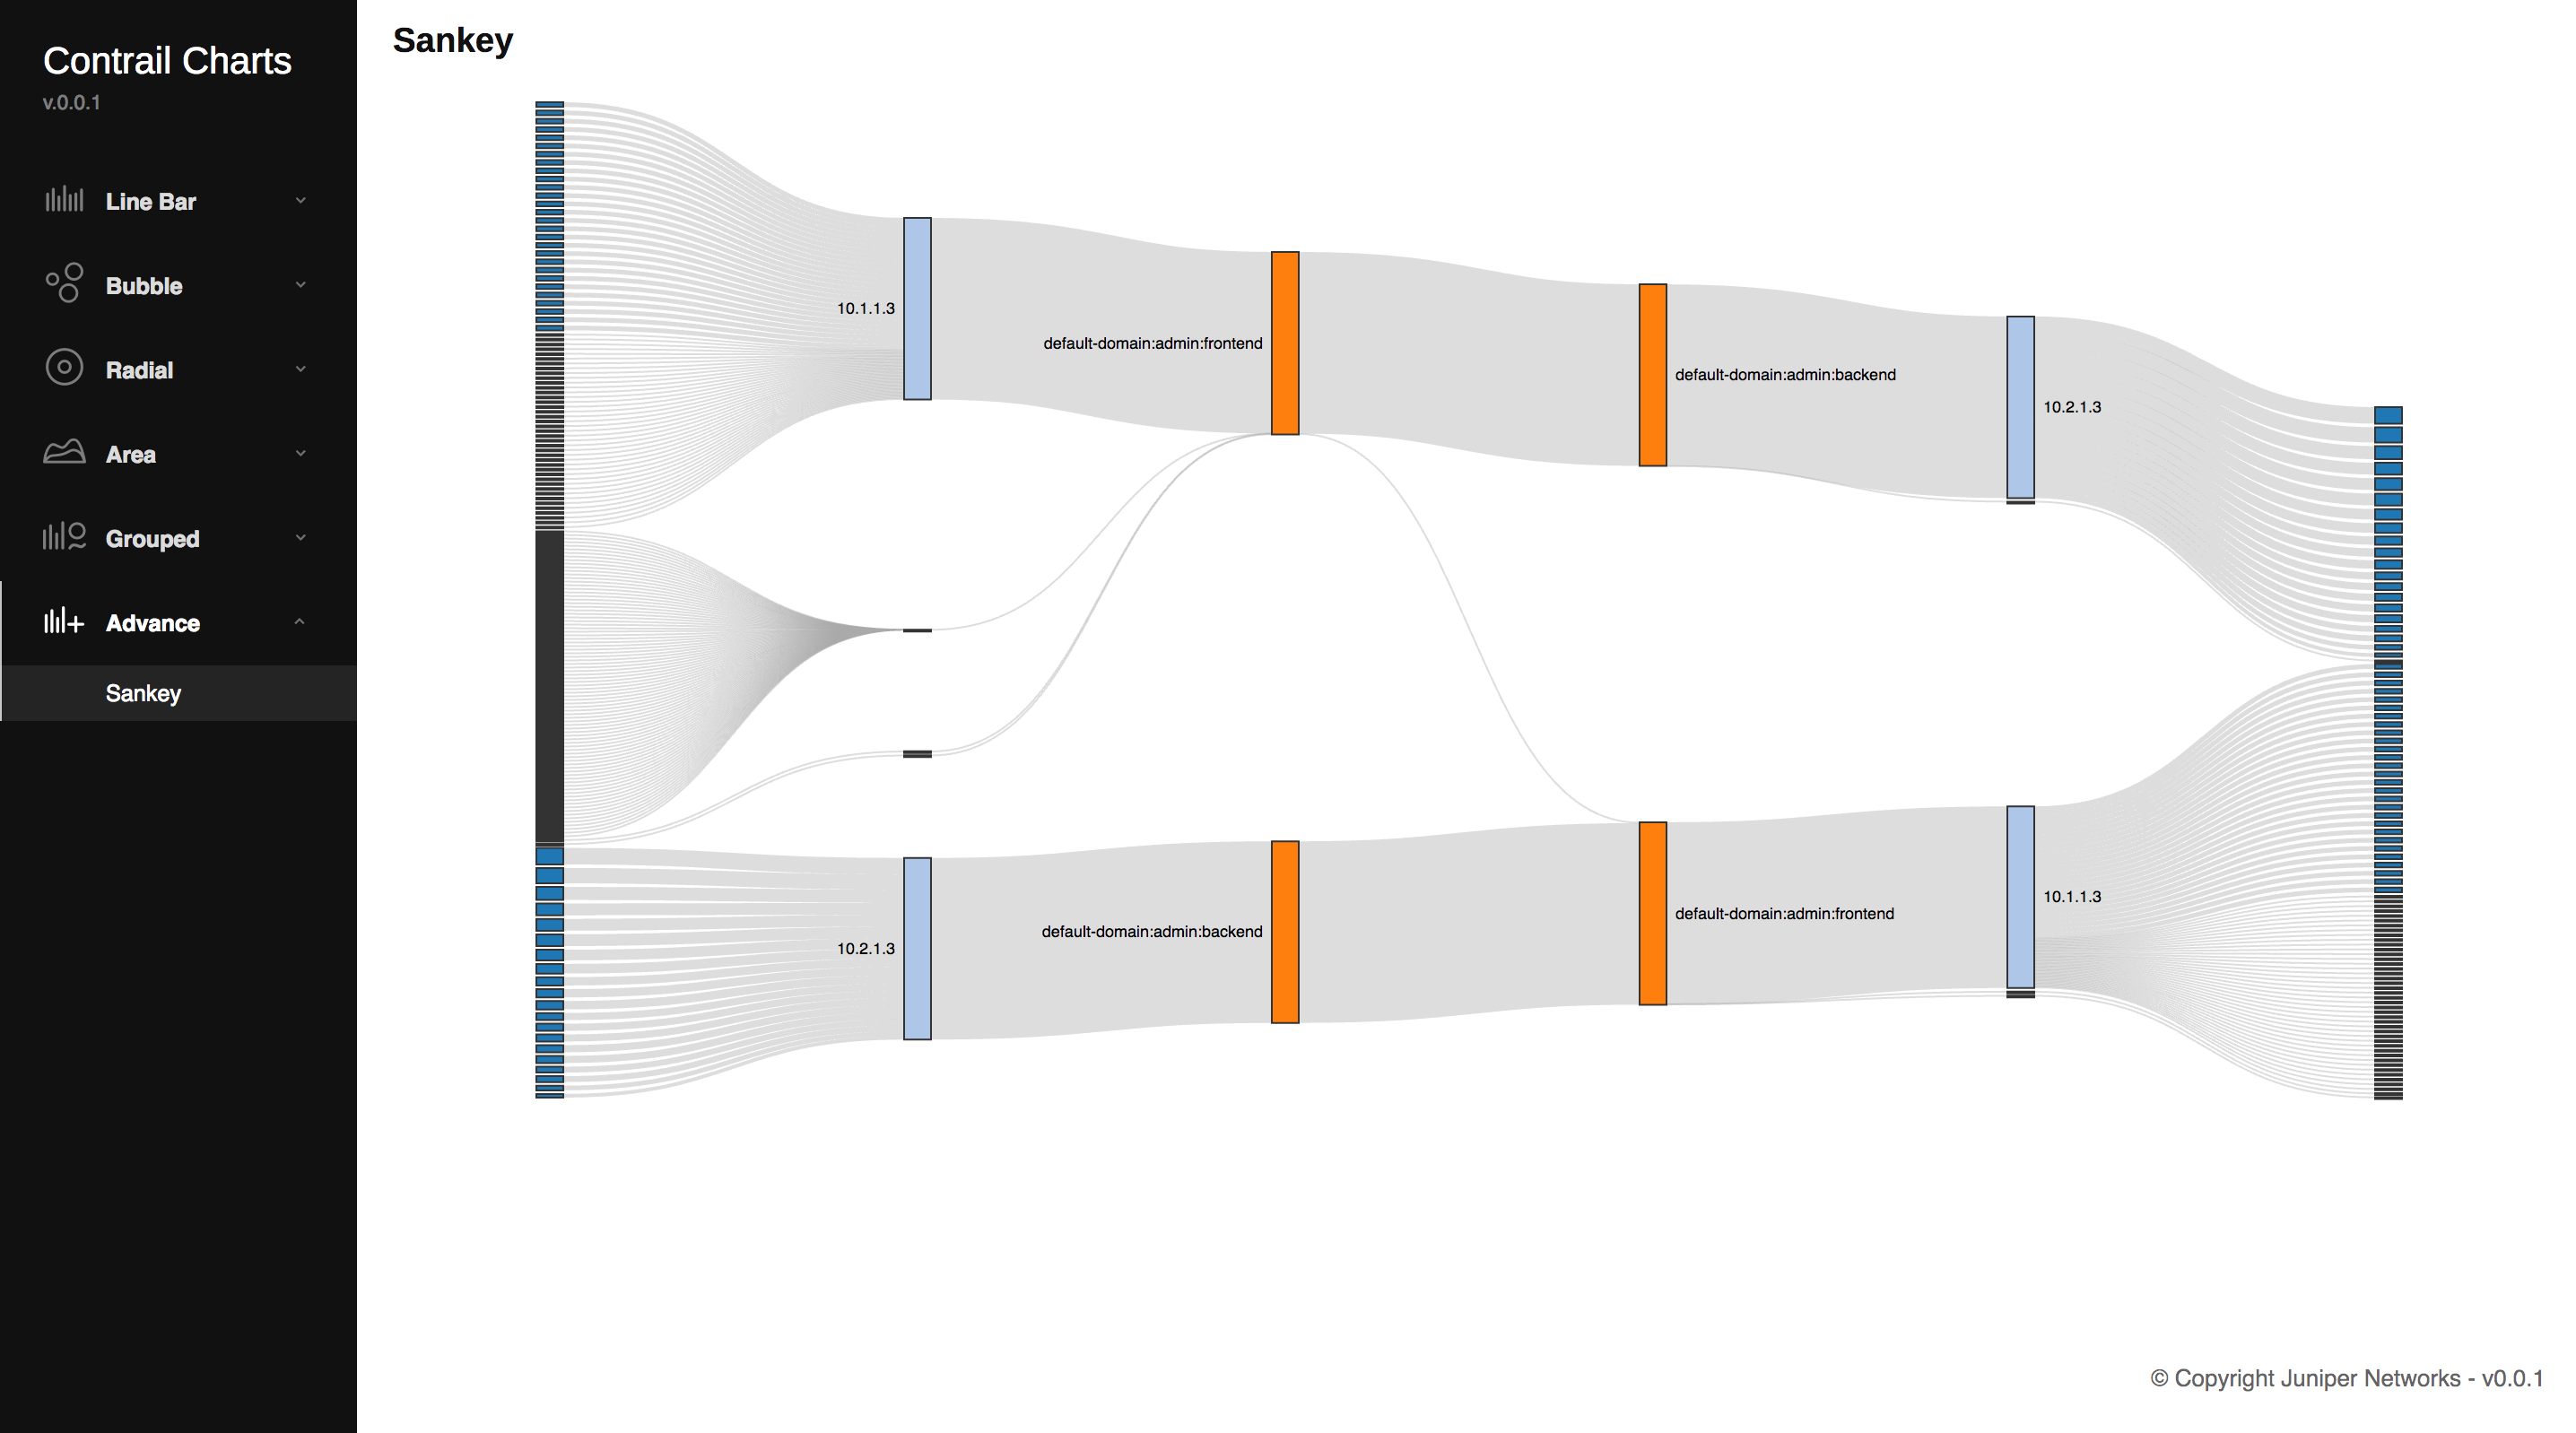
Sankey Chart
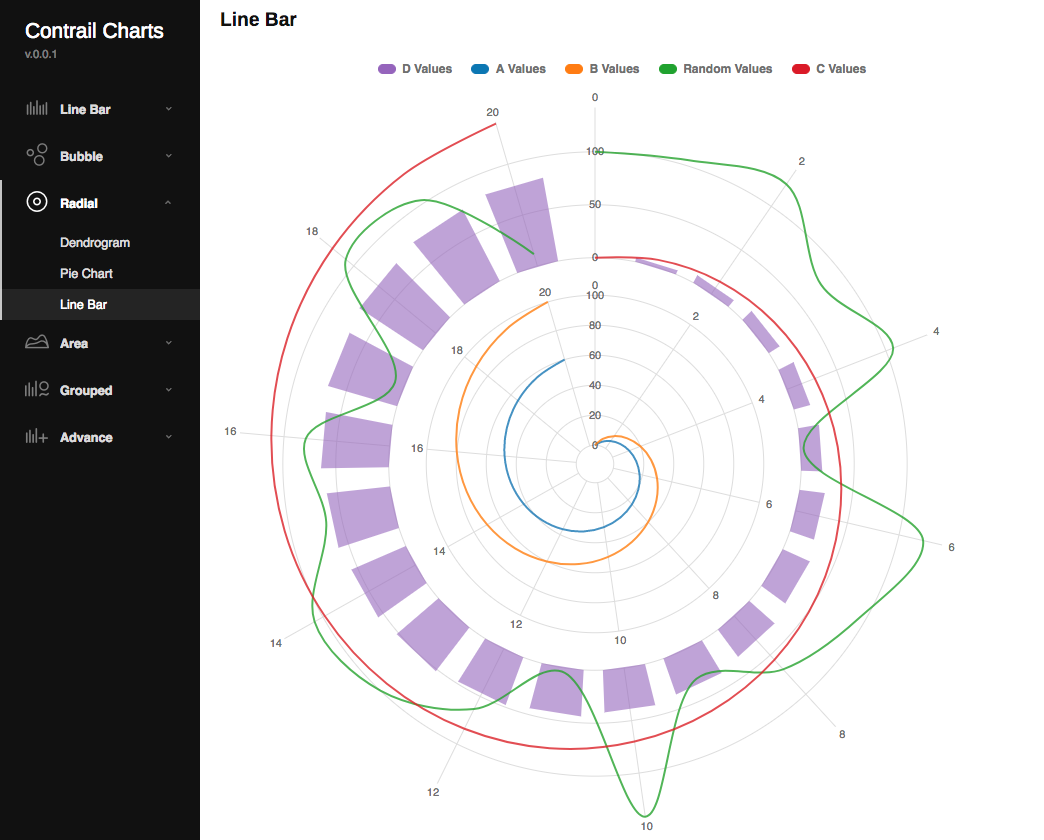
Radial Line Bar Chart
Authors
License
This project is licensed under Apache Version 2.0 - see the LICENSE file for details
Contribution
-
Sign the Contributor License Agreement
-
Guidelines for commit logs
-
Start commit message with a short (~50 characters) 1-line summary paragraph i.e. a single very brief line followed by a blank line. Rest of the commit log can be zero or more paragraphs. Each line within a paragraph should be <= 72 characters.
-
Include a Github issue number by adding Closes #NNN. For more details please read Github help.
-