Backbone.js module of drawing line graph
This is Backbone.js view, model and collection class for drawing HTML5(canvas) line graph.
Install
npm install backbone-graph
How to use it
javascript
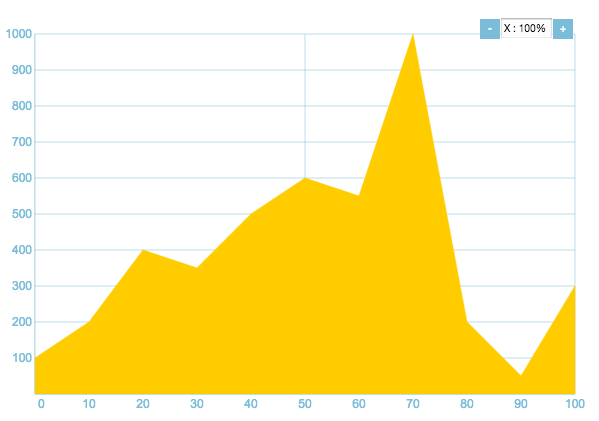
// requirevar $ = ;var Graph = ; // initialize graph datavar lineData = lineColor: "#ffcc00" peakColor: "#ffffff"; // You can also use Graph.PointData() for drawing point graph.var pointData = pointColor: "#ff0000" // This is the default color of each point pointShape: GraphPointDataSHAPEDOWNWARD_TRIANGLE // This is the default shape of each point; // add point to graph datavar graphSample = 0 100 10 200 20 400 30 350 40 500 50 600 60 550 70 1000 80 200 90 50 100 300;graphSample; // add graph data to collectionvar graphCollection = lineData pointData; // initialize graph viewvar graphView = collection: graphCollection width: 600 height: 400 xAxis: max:100 interval:50 subInterval:10 axisColor: AXIS_COLOR yAxis: max:1000 interval:100 subInterval:100 axisColor: AXIS_COLOR range: color: AXIS_COLOR opacity: 05 ;graphView$el; // call change() function to redraw graph graphCollection;style sheet (css)
-
backbone-graph.css
link backbone-graph.css or backbone-graph.min.css in the header section of your html file.
<link rel="stylesheet" href="dist/css/backbone-graph.css"> -
user customize
/* You can change the magnification button position */ /* You can change the magnification button appearance */ /* You can change the magnification number appearance */Graph sample
Normal graph

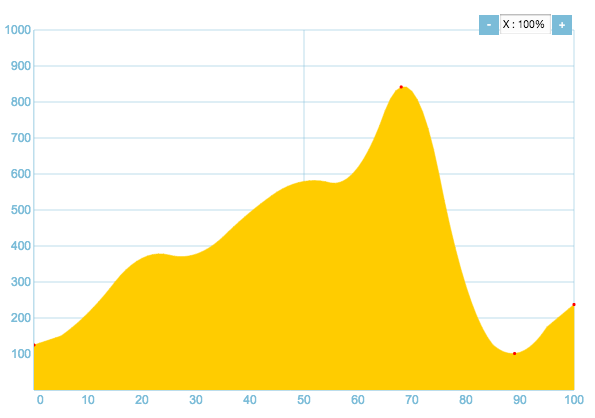
Smoothed graph

How to operate the Graph
-
Magnification
You can change the graph magnification to click the plus / minus button at the top of the graph. The magnification can be changed every 50%, and maximum is 800%.
-
Scroll
You can scroll the graph to drag around the x axis.
-
Select range
You can select the graph range that you want to check in detail. To drag the graph area, you can select the range. After selecting , you can adjust the range to drag the edge of the range. And you can move to drag the center of the range.
Other functions
Graph.LineData.smooth(interval, range, xyRatio, threshould)
interval : Before smoothing graph data, each data should have same interval. So this function re-sample the data with interval parameter.
range : This function calculate moving average to smooth the graph data. range is the range of moving average.
xyRatio : Ratio of x axis unit and y axis unit. For instance, if x axis unit is KM and y is m then xyRatio should be 1000.
threshold : This function calculate peak of the graph by checking change of inclination. threshold is limit value of inclination.
// First this function re-sample the data with interval 1, // Next function calcurate moving average. lineData; console; // you can get peak data arrayconsole; // you can get total gainconsole; // you can get total dropGraph.LineData.unsmooth()
clear the calculated smooth data, peak, total gain and drop.
lineData; Properties
| class | property | type | detail |
|---|---|---|---|
| Graph.PointData / Graph.LineData | max | Graph.Point | Maximum Graph.Point before smoothing. |
| min | Graph.Point | Minimum Graph.Point before smoothing. | |
| xMax | number | maximum x | |
| Graph.LineData | isSmooth | boolean | Whether line data is smoothed or not. |
| smoothStatistics | Object | *1 |
|
| isRangeSelected | boolean | Whether range is selected or not. | |
| rangeStatistics | Object | *2 |
*1Graph.LineData.smoothStatistics
Graph.LineData.smoothStatistics = {
  max : {               // Maximum Graph.Point after smoothing
    x : number,
    y : number
  },
  min : {               // Minimum Graph.Point after smoothing
    x : number,
    y : number
  },
  gain : number,        // total gain
  drop : number,        // total drop
  incline: {
    max : {
      incline: number,  // %
      point : {
        x : number,
        y : number
      }
    },
    min : {
      incline: number,  // %
      point : {
        x : number,
        y : number
      }
    },
    ave : incline       // %
  }
};
*2Graph.LineData.rangeStatistics
Graph.LineData.smoothStatistics = {
  start : number,       // x value of range start
  start : number,       // x value of range end
  width : number,       // range width
  max : {               // Maximum Graph.Point of range
    x : number,
    y : number
  },
  min : {               // Minimum Graph.Point of range
    x : number,
    y : number
  },
  gain : number,        // total gain
  drop : number,        // total drop
  incline: {
    max : {
      incline: number,  // %
      point : {
        x : number,
        y : number
      }
    },
    min : {
      incline: number,  // %
      point : {
        x : number,
        y : number
      }
    },
    ave : incline       // %
  }
};
Event
| class | event | parameter | when event triggers | |-----------------------------------|------------------|----------------------------------------------------------| | Graph.LineData | changeSelection | none | Selected range is changed or unselected | | Graph.PointData | click | index, screenPos | Point is clicked | | | mouseenter | index, screenPos | Mouse cursor enter the point | | | mouseleave | index | Mouse cursor leave from the point or any area is clicked |
