statictrace
Requirements
Node.js 14.15.0 or later.
Installation
Install
npm install @yumemi-inc/statictrace
You can install statictrace either per-project or globally.
Build from source
pnpm install
pnpm run build
ts-node:
pnpx ts-node src/lib.ts -p /absolute/path/to/tsconfig.json
Use as CLI
pnpm run build
pnpm run parse -- -p /absolute/path/to/tsconfig.json
You can omit the -p option by creating an .env file with a TS_PROJECT_CONFIG variable.
TS_PROJECT_CONFIG=/absolute/path/to/tsconfig.json
Other options
-
u, --use <printer>(optional): choose one of default printer types (textormermaid).
Usage
statictrace begins static analysis of your code from a point that is explicitly hinted by a developer. For example, if you want to analyse the registration flow like below, you need to add a JSDoc hint to the function where the flow begins: @entrypoint YourFlowName.
/**
 * @entrypoint Registration
 */
function startRegistration() {
  processRegistration();
  finishRegistration();
  untracedFunction();
  cleanupSomething();
}
Just doing this produces no output but statictrace internally tracks all function and method calls that occur within startRegistration() and every function calls within those functions until there are no calls. In other words, it builds a static stacktrace. If there are any particular functions and methods that you want to test or document, for example to know whether some functions are called, their call order and parent/child relationship, you need to mark relevant functions with another special comment: @trace.
/** @trace */
function processRegistration() {
  someRegistrationProcedure();
}
With this statictrace produces the following output:
Entrypoint: Registration
startRegistration
        processRegistration
                someRegistrationProcedure
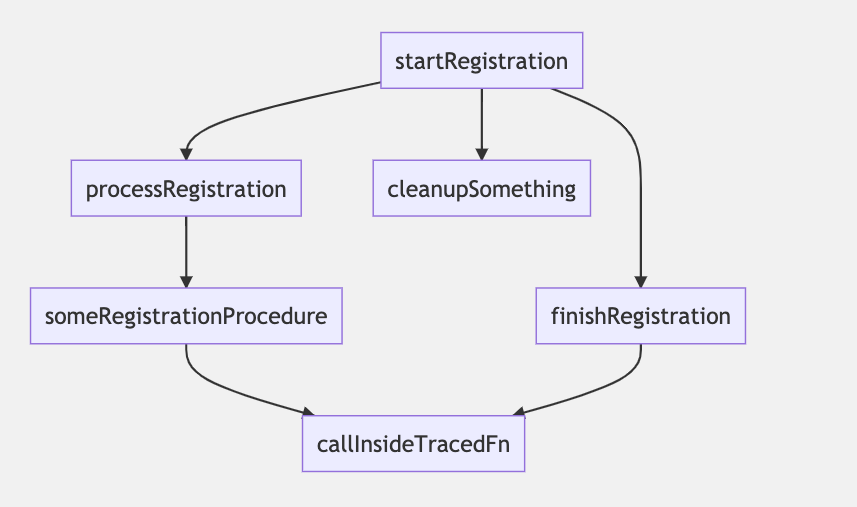
You can use this output as a snapshot of a stacktrace, and use it from your testing library of choice to guarantee that the flow does not change after e.g. refactoring. You can also output the stacktrace as mermaid graphs for documentation purposes (see picture below).
Examples
- Output the result as indented text similar to a debugger stacktrace:
$ statictrace

=======================
Entrypoint: SomeEntrypoint
begin
        funcA
                funcC
        beingNestedEntrypoint
                funcA
                        funcC
                funcB
funcB- Output the result printed as mermaid graphs to a markdown file:
statictrace -u mermaid > graphs.md
This is how rendered mermaid graphs look like:
Use API programmatically
const { run } = require('./build/lib');
const output = run('/absolute/path/to/tsconfig.json', 'text');
// ...do something with output
run(pathToTsConfig: string, printerType: "text" | "mermaid"): any
Load all project files and build a graph of all function calls marked with @entrypoint or @trace tags. You should pass a printer type as a second argument. A printer is an interface that represents anything that can print (display the static analysis result in one way or another). Currently you cannot provide your own implementations but can choose one of the default ones.
