🌡️ Koa Prometheus
A configurable Prometheus data collector with Koa middleware
Overview | Usage | Api | Configuration | Contributors
Overview
This package is a thin wrapper around
prom-client &
metrics, to provide
prometheus formatted metrics for Koa applications.
It provides the following types of metric;
- 📊 Histogram - Raw number counts, bucketed
- 📈 Summary - Percentile calculated buckets
- ⏱ Meter - an EWMA decaying gauge for counting over time
- 🌡 Gauge - A counter that can go both up and down
- 🎚 Counter - Count number of times something happens
- 🏷 Labelling - Labelling to enable powerful Prometheus querying
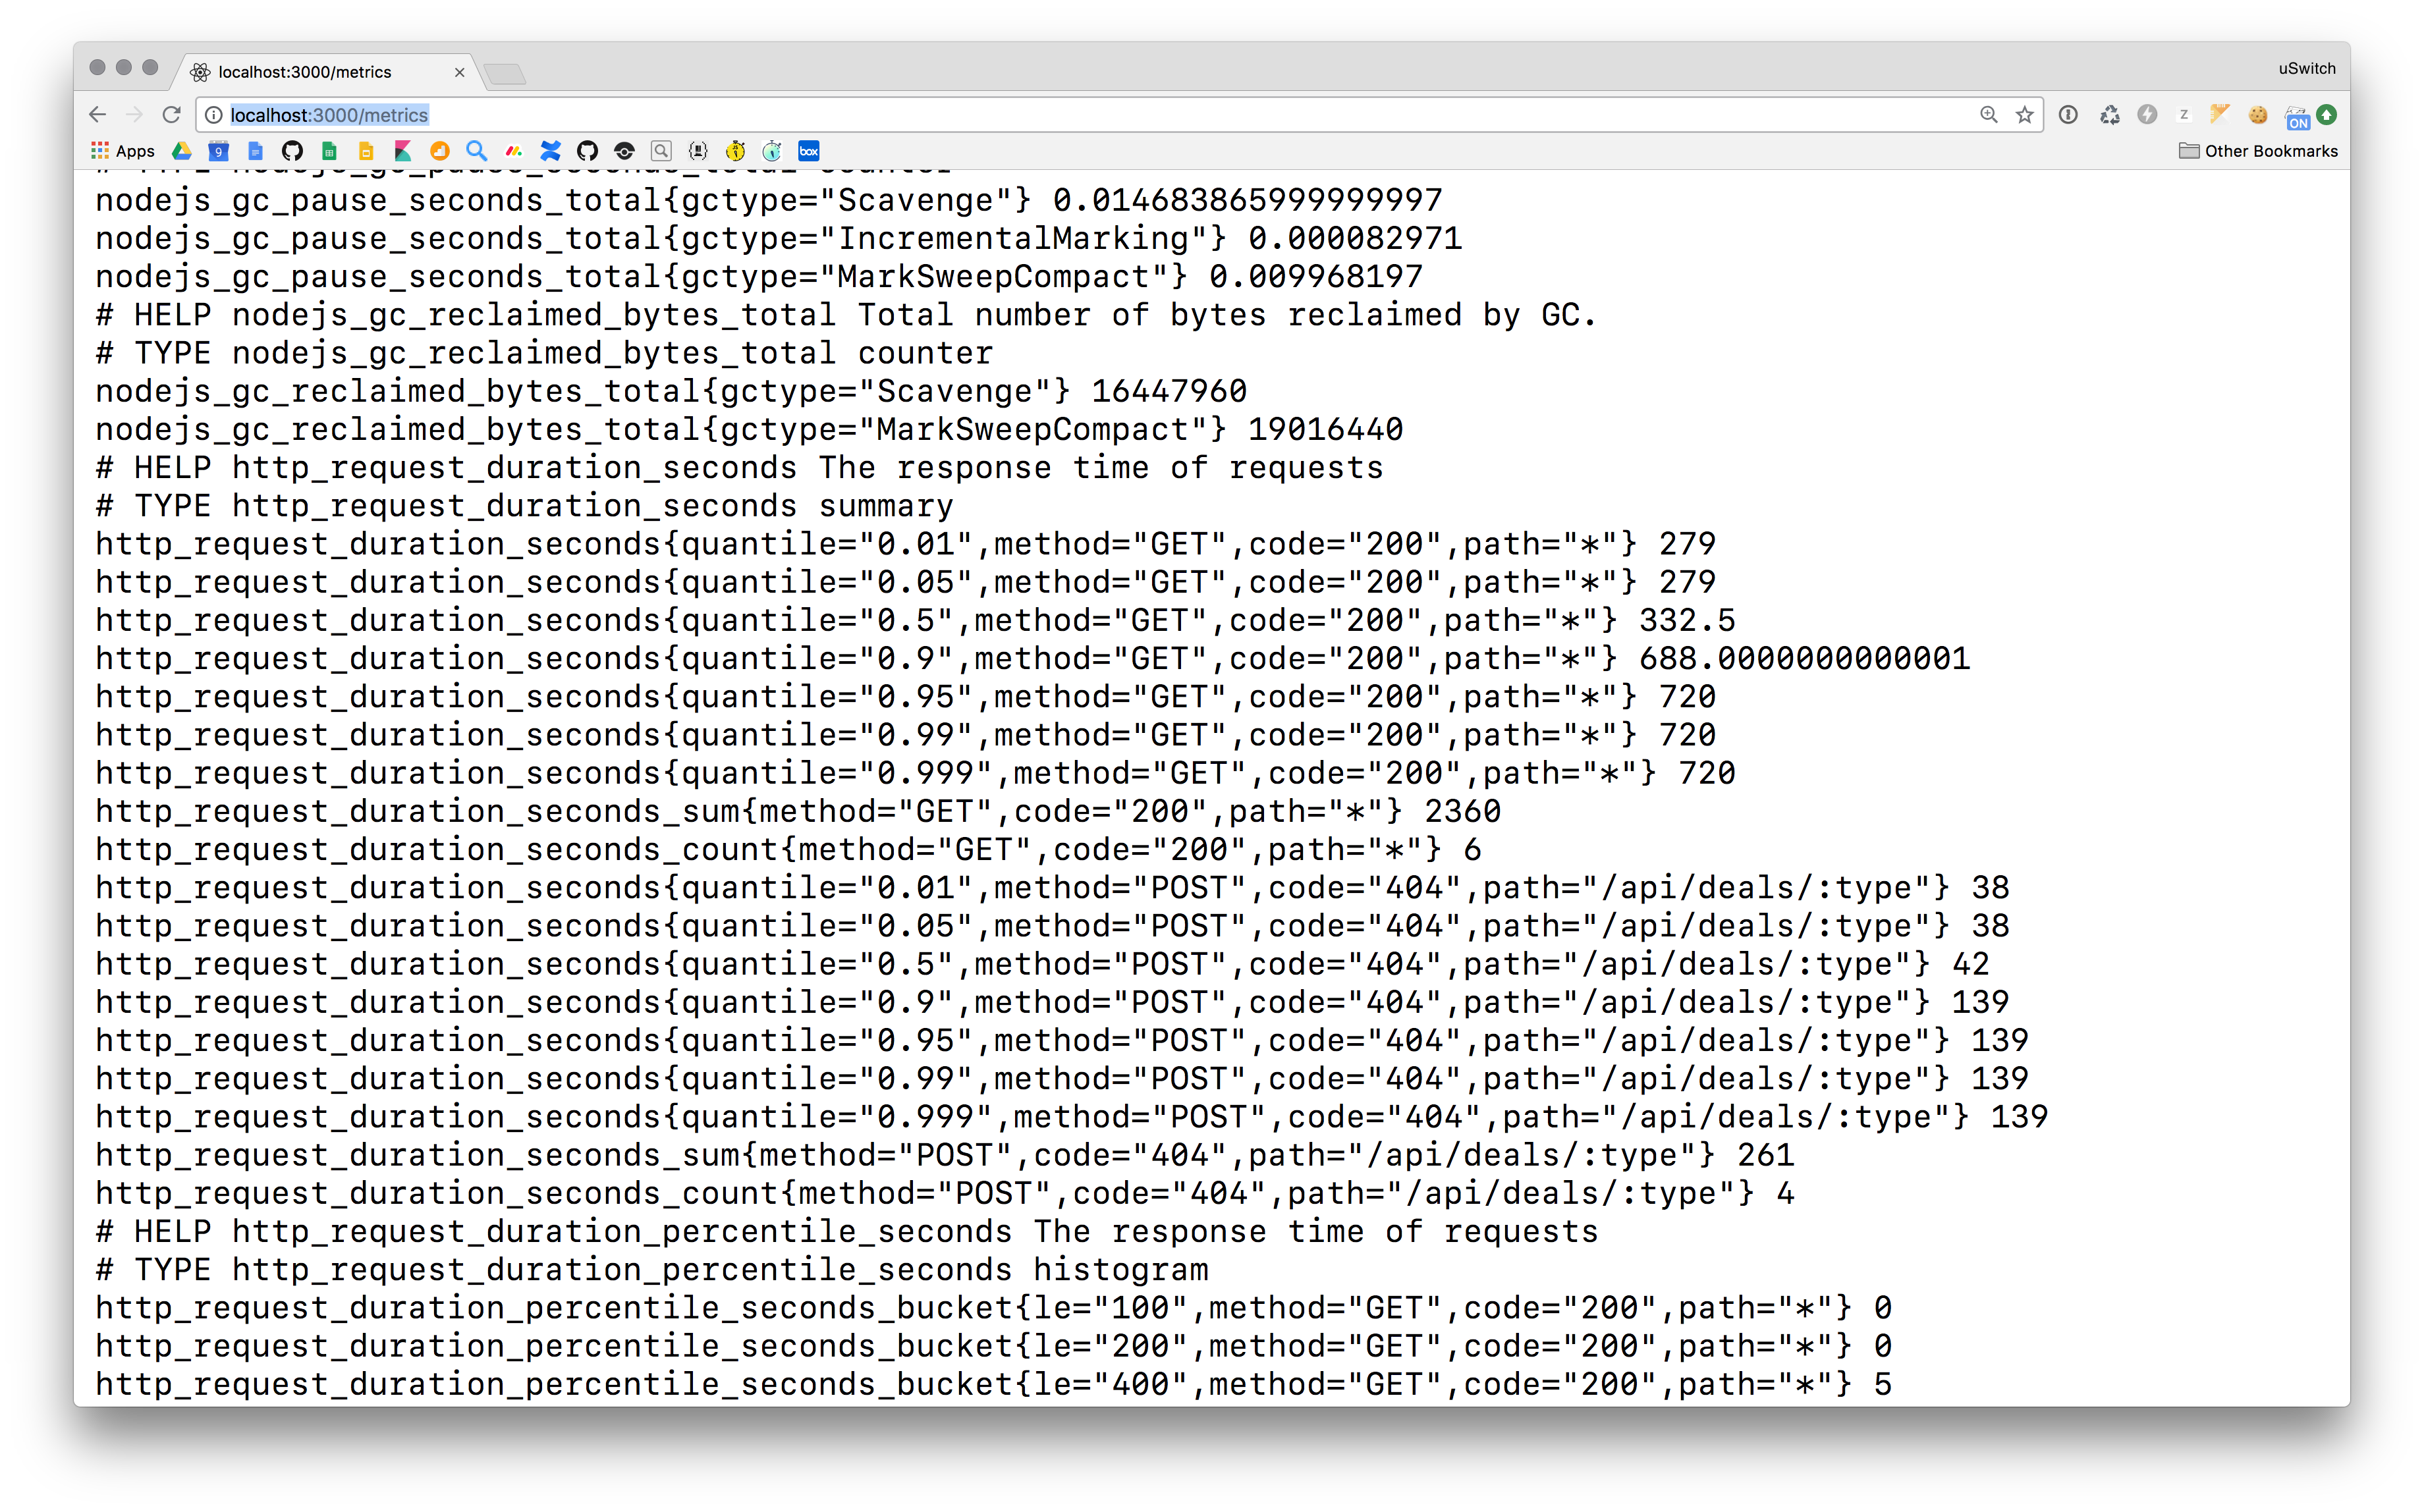
It will also provide you with a /metrics endpoint to expose these
metrics to prometheus
Usage
koa-prometheus is purely config
based
and configurable, but you can attach it to your Koa service using
default metrics with the following;
import Koa from 'koa'
import Meter from '@uswitch/koa-prometheus'

const app = new Koa()
const meters = Meter({ /* Config */ }, { loadDefaults: true })

app.use(meters.middleware)   // The middleware that makes the meters available

app.get('/metrics', async (ctx) => (ctx.body = await meters.print()))

app.on(eventAccess, (ctx) => meters.automark(ctx))
app.on(eventError, () => meters.errorRate.mark(1))

app.listen(3000, () => signal.start(Listening on port 3000))
N.B. See koa-core
Purely config
The main philsophy of Koa prometheus is to provide a way to configure the metrics, and how to collect them, in pure JSON.
To do this, you can create a config file that contains a list of metrics, .e.g
[
  // A manually invoked meter
  {
    "name": "namespace_metric_name",
    "help": "A description of the metric",
    "type": "Counter"
  },
  // An `automark` meter
  {
    "name": "namespace_autocollected_metric",
    "help": "A description of the metric",
    "type": "Histogram",
    "labelNames": [
      { "key": "method", "path": ["path", "to", "method"] },
      { "key": "status", "path": ["path", "to", "status"] }
    ],
    "mark": {
      "method": "observe",
      "path": [ "path","to","value" ]
    }
  }
]
See the
schema
or the
defaults
for a more detailed look at how they are configured.
API
You get back the configured meter when you instantiate it, and you will get
Manually marking a meter
If you have a manual meter it will be available on the meters
object.
If you want to add labels to the meter, you must add them in the
order they are defined in the config, i.e.
// "labelName": [ "a", "b", "c" ]

meter
  .myMeter
  .labels("value for a", "value for b", "value for c")
  .inc(1)
NodeJS metrics & GC Metrics
This library also utilises prom-client's collectDefaultMetrics &
node-prometheus-gc-stats
to collect CPU & Garbage Collection stats
Service standard metrics
To comply with Uswitch service standard monitoring, enable service standards:
const meters = Meter({ /* Config */ }, { loadStandards: true })These will overwrite the http_request_duration_seconds, http_requests_total and errors_total metrics. The first two are automarked by @uswitch/koa-access. Mark the errors_total metric manually:
// Directly
app.on('error', (err, ctx) => {
  meters.errorsTotal.labels(err.name).inc(1)
})
// Or with @uswitch/koa-tracer
app.on(eventError, (err, ctx) => {
  meters.errorsTotal.labels(err.name).inc(1)
})
Contributors
Thanks goes to these wonderful people (emoji key):
|
Dom Charlesworth 📖 💻 🤔 🔌 |
David Annez 💻 🤔 🔌 |
|---|
This project follows the all-contributors specification. Contributions of any kind welcome!


