
The Angular Diagram component is used for visualizing, creating, and editing interactive diagrams. It supports creating flowcharts, organizational charts, mind maps, floor plans, UML diagrams, and BPMN charts either through code or a visual interface.
Getting started . Online demos . Learn more
Trusted by the world's leading companies

You can use Angular CLI to setup your Angular applications. To install the Angular CLI, use the following command.
npm install -g @angular/cliCreate a new Angular application using the following Angular CLI command.
ng new my-app
cd my-appAll Syncfusion Angular packages are available in npmjs.com. To install the Angular diagram package, use the following command.
ng add @syncfusion/ej2-angular-diagramsThe above command does the below configuration to your Angular app.
- Adds
@syncfusion/ej2-angular-diagramspackage and its peer dependencies to yourpackage.jsonfile. - Imports the
DiagramModulein your application moduleapp.module.ts. - Registers the Syncfusion UI default theme (material) in the
angular.jsonfile.
This makes it easy to add the Syncfusion Angular Diagram module to your project and start using it in your application.
In src/app/app.component.ts, use <ejs-diagram> selector in the template attribute of the @Component directive to render the Syncfusion Angular Diagram component.
import { Component, OnInit } from '@angular/core';

@Component({
    selector: 'app-root',
    template: `<ejs-diagram #diagram id="diagram" width="100%" height="700px">
          <e-nodes>
            <e-node id="begin" [height]="40" [offsetX]="300" [offsetY]="80" [shape]="terminator">
              <e-node-annotations>
                <e-node-annotation content="Begin"> </e-node-annotation>
              </e-node-annotations>
            </e-node>
            <e-node id="process" [height]="80" [offsetX]="300" [offsetY]="160" [shape]="decision">
              <e-node-annotations>
                <e-node-annotation content="Process"> </e-node-annotation>
              </e-node-annotations>
            </e-node>
            <e-node id="end" [height]="40" [offsetX]="300" [offsetY]="240" [shape]="process">
              <e-node-annotations>
                <e-node-annotation content="End"> </e-node-annotation>
              </e-node-annotations>
            </e-node>
          </e-nodes>
          <e-connectors>
            <e-connector id="connector1" sourceID="begin" targetID="process">
            </e-connector>
            <e-connector id="connector2" sourceID="process" targetID="end">
            </e-connector>
          </e-connectors>
        </ejs-diagram>`
})
export class AppComponent implements OnInit {
    public terminator: FlowShapeModel = { type: 'Flow', shape: 'Terminator' };
    public decision: FlowShapeModel = { type: 'Flow', shape: 'Decision' };
}Diagram component is also offered in the following list of frameworks.
 JavaScript |
 React |
 Vue |
 ASP.NET Core |
 ASP.NET MVC |
|---|
- Angular Diagram Builder demo
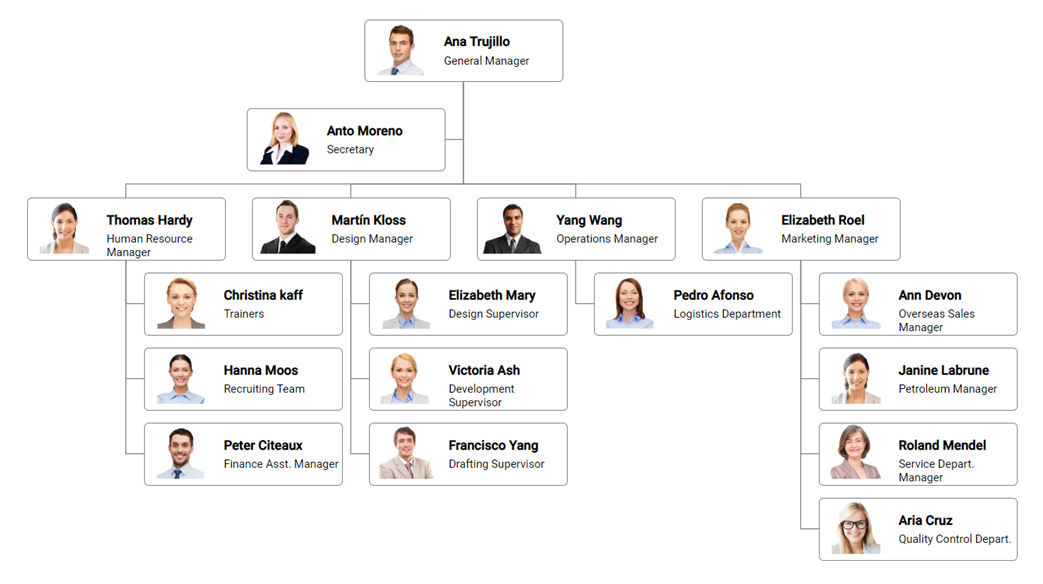
- Angular Organizational Chart demo
- Angular Mind Map demo
- Angular BPMN Editor demo
- Angular Logic Circuit Diagram demo
- Angular UML Activity Diagram demo
- Angular Network Diagram demo
- Angular UML Class Diagram demo
- Angular Venn Diagram demo
- Angular Fishbone Diagram demo
- Nodes - Nodes are used to host graphical objects (path or controls) that can be arranged and manipulated on a diagram page. Many predefined standard shapes are included. Custom shapes can also be created and added easily.
- Connectors - The relationship between two nodes is represented using a connector.
- Labels- Labels are used to annotate nodes and connectors.
- Ports - Ports act as the connection points of the node and allows to create connections with only those specific points.
- Interactive features - Interactive features are used to improve the run time editing experience of a diagram.
- Data binding - Generates diagram with nodes and connectors based on the information provided from an external data source.
- Commands - Supports a set of predefined commands that helps edit the diagram using keyboard. It is also possible to configure new commands and key combinations.
- Automatic layout - Automatic layouts are used to arrange nodes automatically based on a predefined layout logic. There is built-in support for organizational chart layout, hierarchical tree layout, symmetric layout, radial tree layout, and mind map layout.
- Overview panel - The overview panel is used to improve navigation experience when exploring large diagrams.
- SymbolPalettes - The symbol palette is a gallery of reusable symbols and nodes that can be dragged and dropped on the surface of a diagram.
- Rulers - The ruler provides horizontal and vertical guides for measuring diagram objects in diagram component.
- Serialization - When saved in JSON format a diagram’s state persists, and then it can be loaded back using serialization.
- Exporting and Printing - Diagrams can be exported as .png, .jpeg, .bmp, and .svg image files, and can also be printed as documents.
- Gridlines - Gridlines are the pattern of lines drawn behind diagram elements. It provides a visual guidance while dragging or arranging the objects on a diagram surface.
- Page layout- The drawing surface can be configured to page-like appearance using page size, orientation, and margins.
- Context menu - Frequently used commands can easily be mapped to the context menu.
Product support is available through the following mediums.
- Support ticket - Guaranteed Response in 24 hours | Unlimited tickets | Holiday support
- Community forum
- GitHub issues
- Request feature or report bug
- Live chat
Check the changelog here. Get minor improvements and bug fixes every week to stay up to date with frequent updates.
This is a commercial product and requires a paid license for possession or use. Syncfusion’s licensed software, including this component, is subject to the terms and conditions of Syncfusion's EULA. To acquire a license for 80+ Angular UI components, you can purchase or start a free 30-day trial.
A free community license is also available for companies and individuals whose organizations have less than $1 million USD in annual gross revenue and five or fewer developers.
See LICENSE FILE for more info.
© Copyright 2024 Syncfusion, Inc. All Rights Reserved. The Syncfusion Essential Studio license and copyright applies to this distribution.