<multi-verse>
Polymer elements for graphical and interactive multivariate analysis (built on top of universe) and using d3.js V4, crossfilter and reductio under the hood.
Charts are rendered using multi-chart. They are data driven and reactive, providing instant feedback to user interaction.
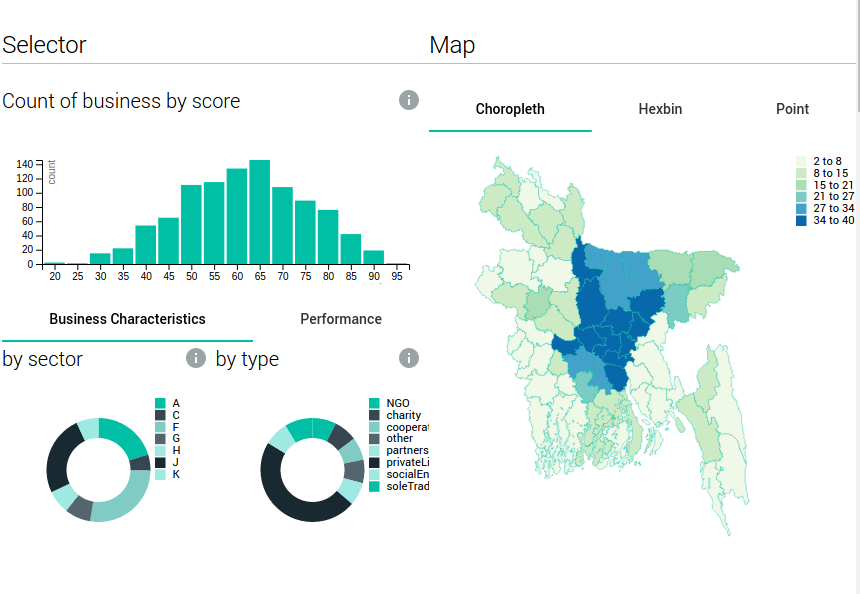
Example of multi-verse in a interactive dashboard
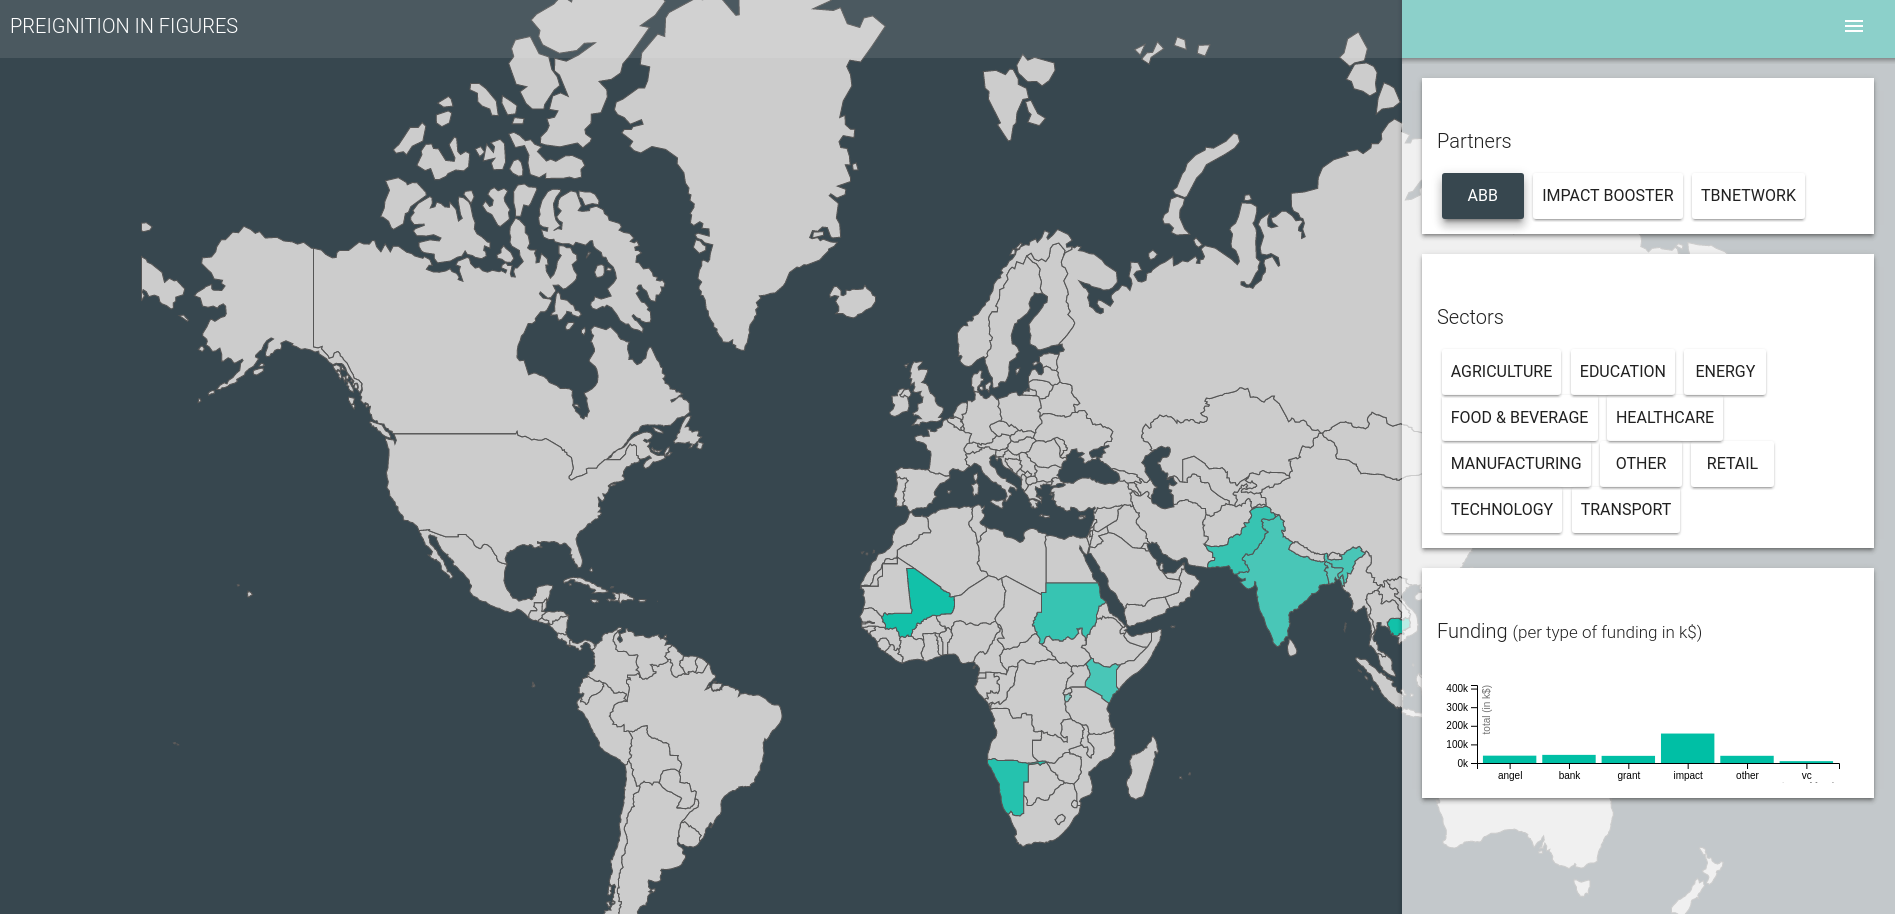
Other advanced example - available from the demo
Simple Example
 <!-- Load the data -->
 <multi-csv url="flight.csv" data="{{data}}"></multi-csv>
 <!-- Start a multi-verse -->
  <multi-verse id="universe" data="[[data]]" universe="{{universe}}">
 		<!-- Group the data by distances-->
    <multi-group universe="[[universe]]" data="{{data-chart-distance}}" group-by="distances">
 			<!-- Render this group in a bar chart-->
      <multi-verse-bar title="distance" data="[[data-chart-distance]]"> </multi-verse-bar>
    </multi-group>
 		<!-- Group the data by day-->
    <multi-group universe="[[universe]]" data="{{data-chart-day}}" group-by="day">
 			<!-- Render this group in a pie chart-->
      <multi-verse-pie title="day (pie)" data="[[data-chart-day]]" color-scale="{{colorScale}}" width="{{width}}">
      	<!-- Add a color scale legend to the chart -->
        <multi-legend legend chart-width="[[width]]" scale="[[colorScale]]" position="top-right"></multi-legend>
      </multi-verse-pie>
    </multi-group>
  </multi-verse>