docsify-charty
by Mark Battistella
Installation
Update index.html file
-
Add the following script and stylesheet to your
index.htmlvia either CDN or downloading it and using it locally:unpkg.com
<script src="//unpkg.com/@markbattistella/docsify-charty@latest/dist/docsify-charty.min.js"></script>
<link rel="stylesheet" href="//unpkg.com/@markbattistella/docsify-charty@latest/dist/docsify-charty.min.css">
jsDelivr.com
<script src="//cdn.jsdelivr.net/npm/@markbattistella/docsify-charty@latest"></script>
<link rel="stylesheet" href="//cdn.jsdelivr.net/npm/@markbattistella/docsify-charty@latest/dist/docsify-charty.min.css">
locally
<script src="docsify-charty.min.js"></script>
<link rel="stylesheet" href="docsify-charty.min.css">
-
In docsify setup configure the plugin (see configuration for setup). These are the global settings and affect all charts:
window.$docsify = {
  charty: {
    "theme": String,
    "mode":  String,
    "debug": Boolean
  }
};
npm install
Or if you're using npm to manage your dependencies:
npm i @markbattistella/docsify-chartyConfiguration
Global settings
Example: index.html
| Name | Type | Example | Description |
|---|---|---|---|
theme |
String |
"#EE5599" | Global theme for chart colours in HEX |
mode |
String |
"light" | Accepts "dark" or "light" |
debug |
Boolean |
false | Console logs if charts aren't loading |
Per chart settings
| Name | Accepts | Description |
|---|---|---|
title |
String |
The title of the chart, displayed at the top. Leave blank if you want to hide it |
caption |
String |
The sub-text of the chart, displayed under the title. Leave blank to hide it |
type |
String |
The type of charty you want to display |
options.theme |
String |
Set an individual theme to this chart. It will override the global theme |
options.legend |
Boolean |
Show the legend. Default true
|
options.labels |
Boolean |
Show the chart labels. Default true
|
options.numbers |
Boolean |
Show the chart numbers. Default true
|
data.label |
String |
Graphed data point label |
data.value |
Int / Array |
Graphed value that puts it on the render |
data.colour |
String |
Override the global and theme with a specific colour |
Markdown code
```charty
{
  "title":   '',
  "caption": '',
  "type":    '',
  "options": {
    "theme":   '',
    "legend":  '',
    "labels":  '',
    "numbers": ''
  },
  "data": [
    {
      "label": '',
      "value": '',
      "colour": ''
    }
  ]
}
// close the code block
// can't show it here
Types of charts
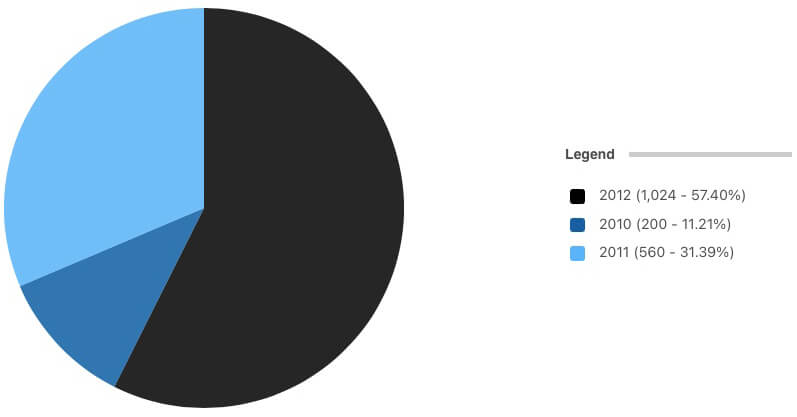
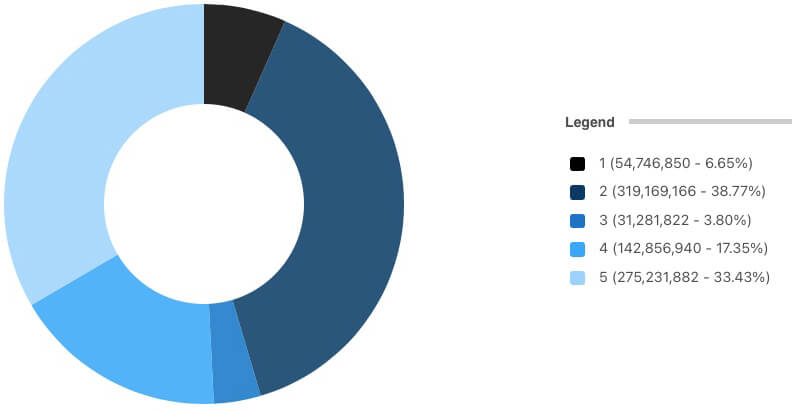
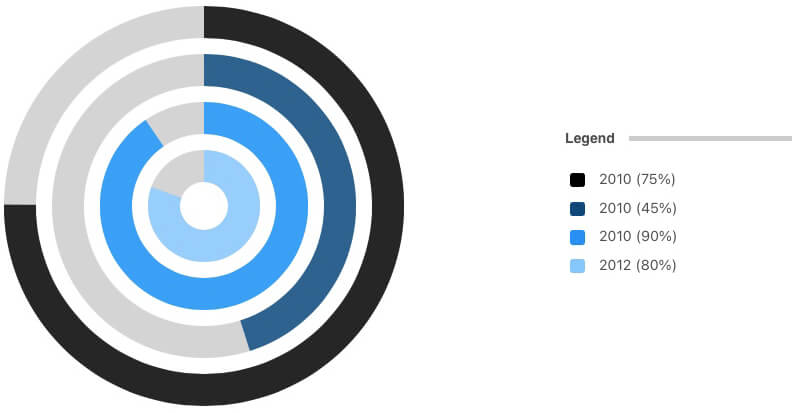
Circular
pie
donut / doughnut
section / sectional
rings
Area
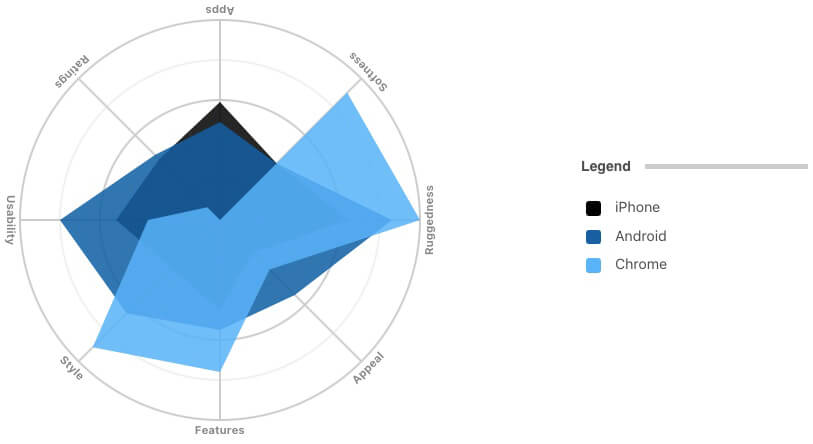
radar
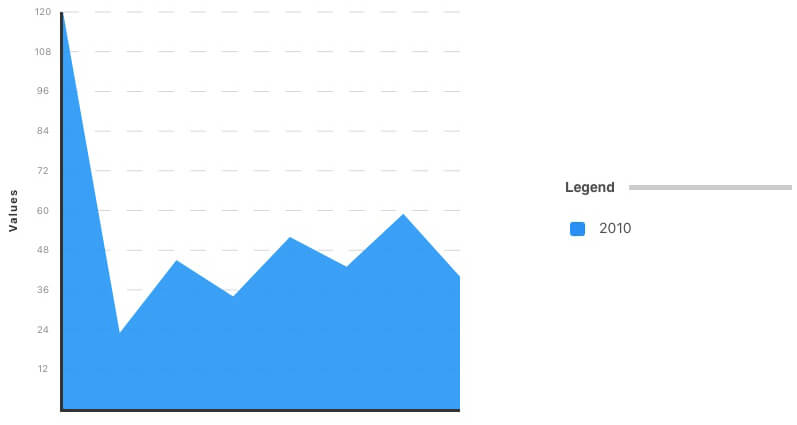
area
Plot
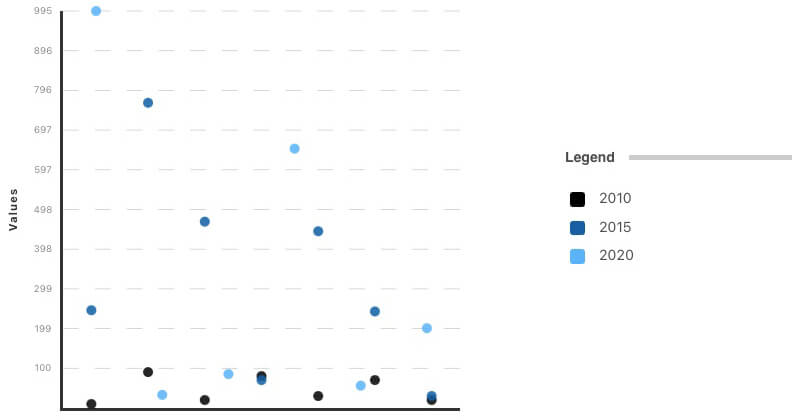
scatter
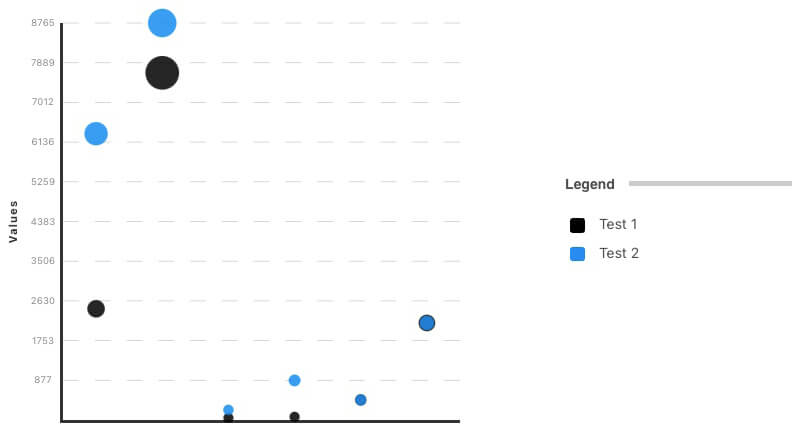
bubble
line
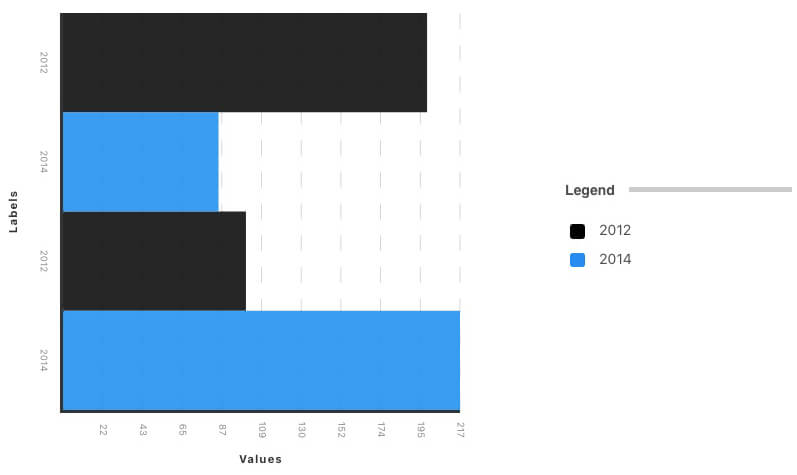
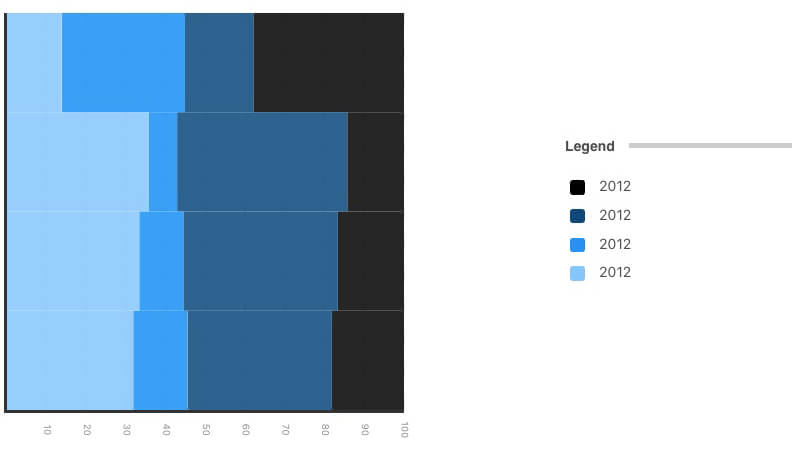
Bar / Column
bar / bar-stack
column / column-stack
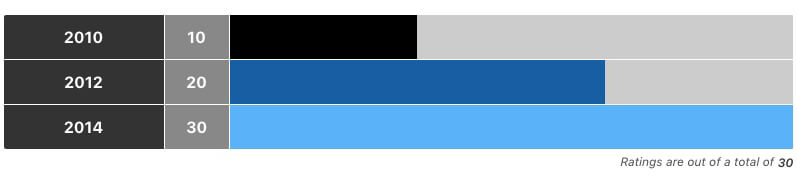
Rating
Contributing
-
Clone the repo:
git clone https://github.com/markbattistella/docsify-charty.git -
Create your feature branch:
git checkout -b my-feature -
Commit your changes:
git commit -am 'Add some feature' -
Pushto the branch:git push origin my-new-feature -
Submit the
pullrequest